
I recently revisited an interview by Mr. Raamdeo Agrawal, where he said “I am very happy when the markets fall and I can buy something that adds more value to my portfolio. Markets don’t understand high quality value in the short term. Focusing on value is the key. What we have learnt is that the value of the company remains steady even if there are external events. Only the price changes. Till 1998 nobody knew about the index. People looked at only individual stocks. This focus on index has spoilt the game. We focus on value instead.“
The question I am seeking an answer to is whether the index really matters or is it just plain noise and we should be focusing instead on what our portfolio companies are doing currently and expected to do in the future, while disregarding what the market does.
The idea behind doing this post is to explore what happens when a small or a mid cap investor buys a basket of growing small caps and does not worry about the small cap index or the Nifty or the Sensex or any other indexes, at all. And should one really worry about index levels if businesses we are holding in our portfolios are doing well regardless? Articulated differently, is time in the markets more important than timing the markets.
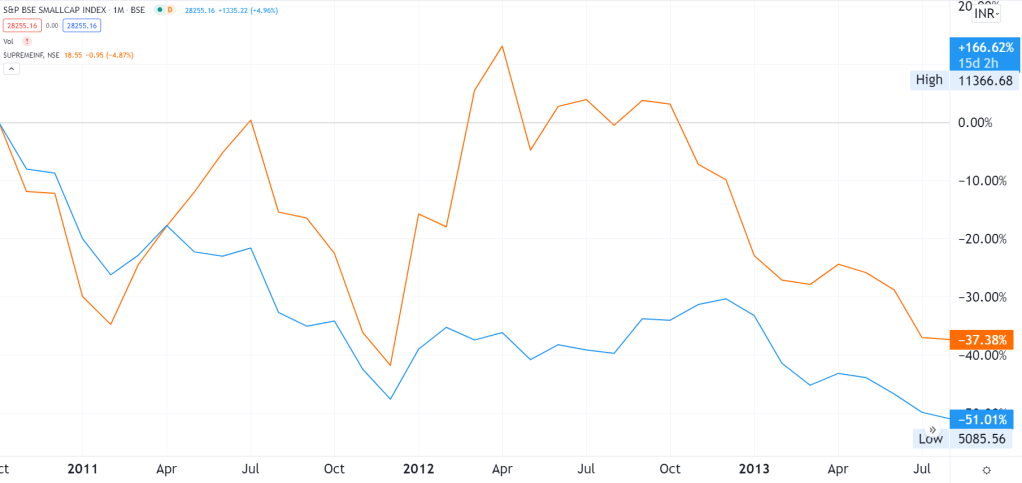
What kind of profits or losses would one encounter, if he/she bought small & mid caps in Nov 2010, when the small cap index topped out & held them until Aug 2013, when the index was down by 54% from its previous peak?
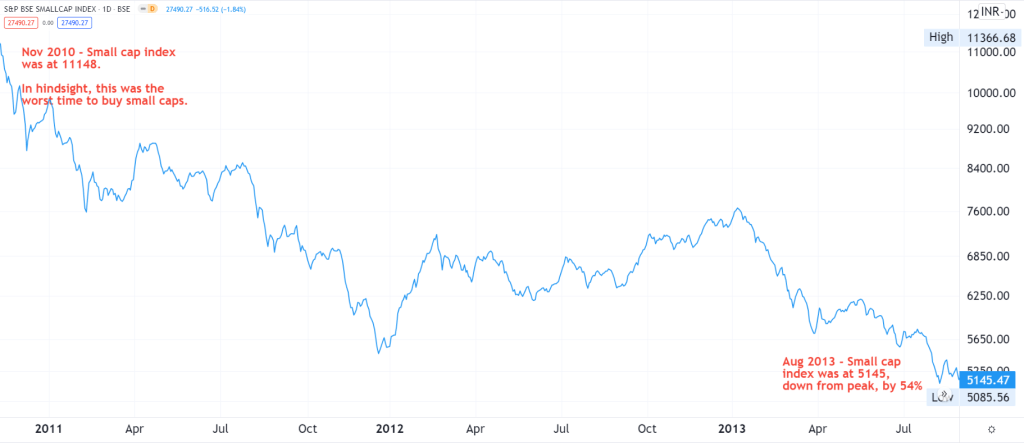
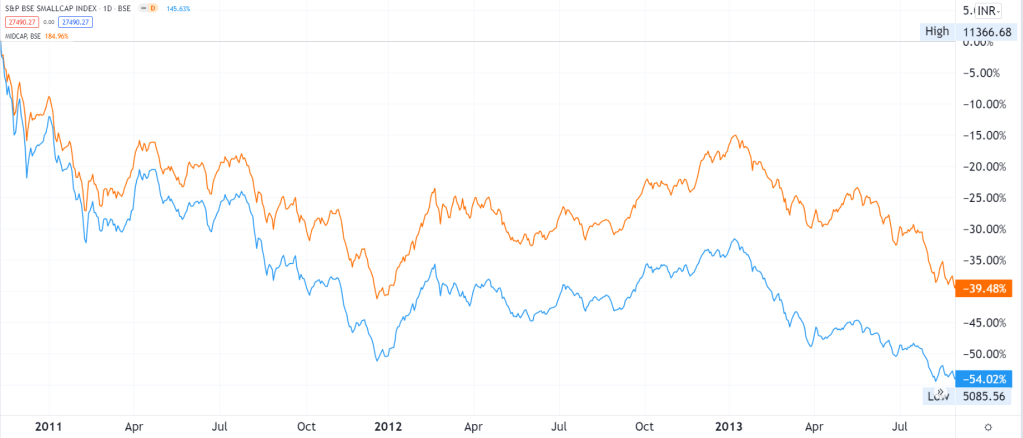
And here’s how the BSE Mid cap index moved during the same period. The mid cap index was down by 40% while the small cap index was down by 54%
Methodology used
- Filtered companies that grew their profits by at least 15% in FY2009, FY2010 & FY2011.
- Removed a handful of companies where charts are not available due to corporate actions such as delisting, mergers, etc.
- Removed large caps since most of us are interested in small/mid caps only.
- Analyzed the out-performers from this group.
- Dividends excluded.
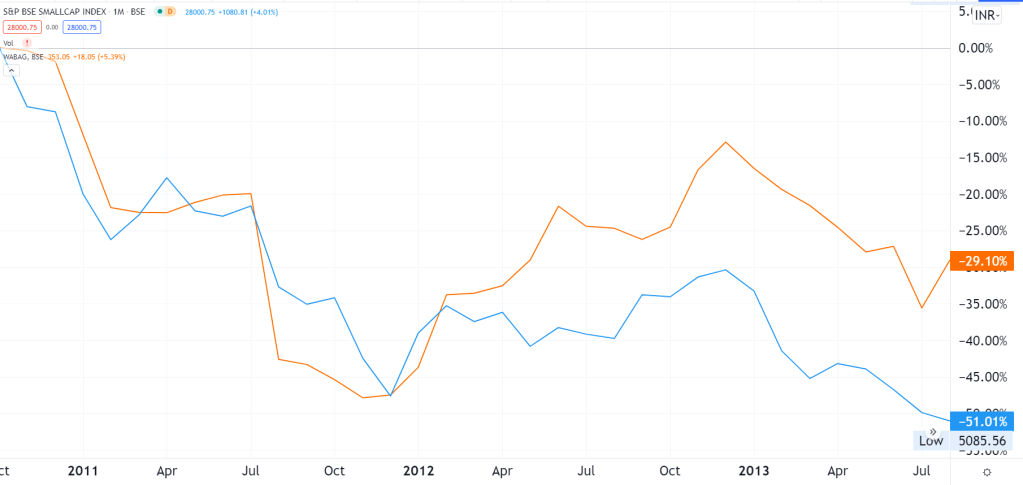
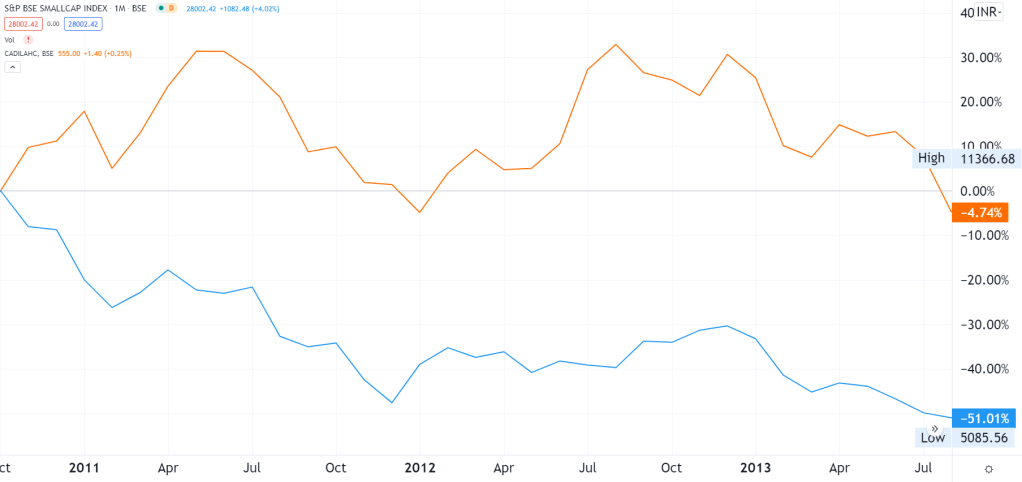
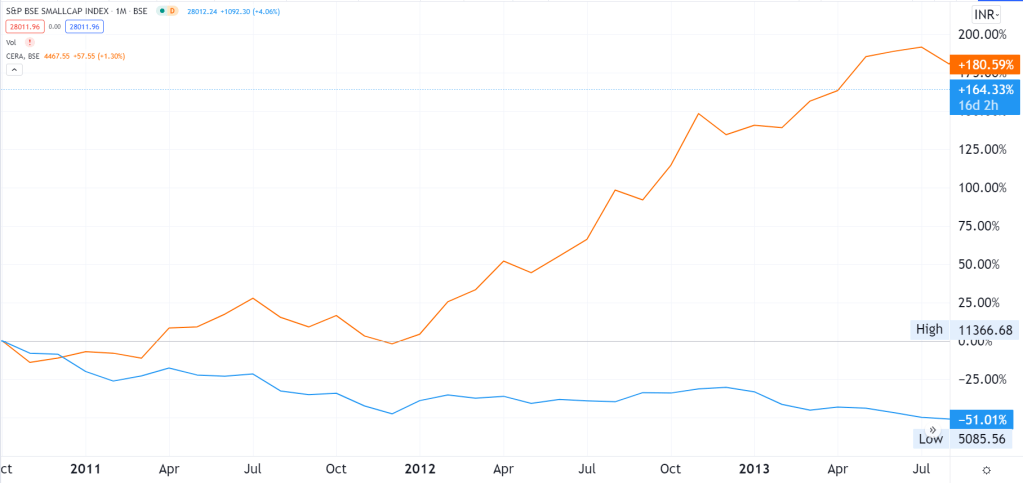
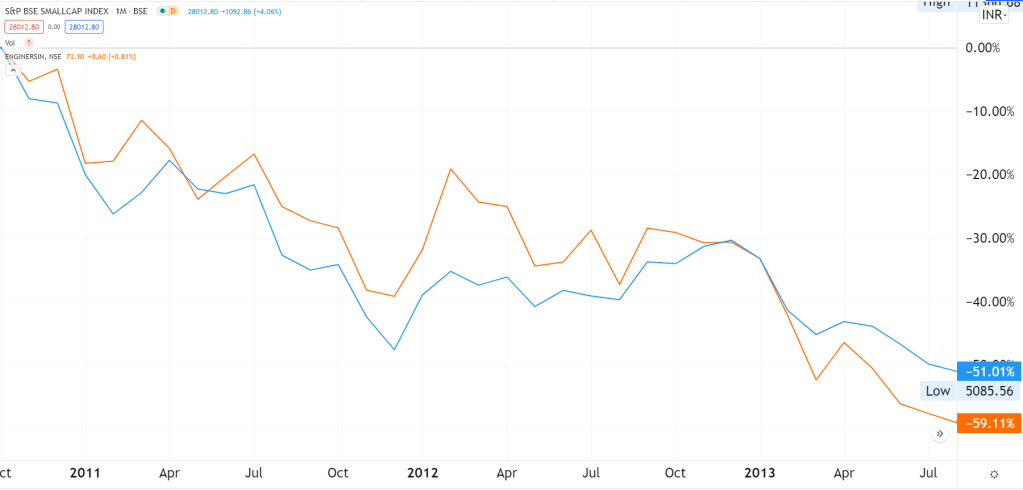
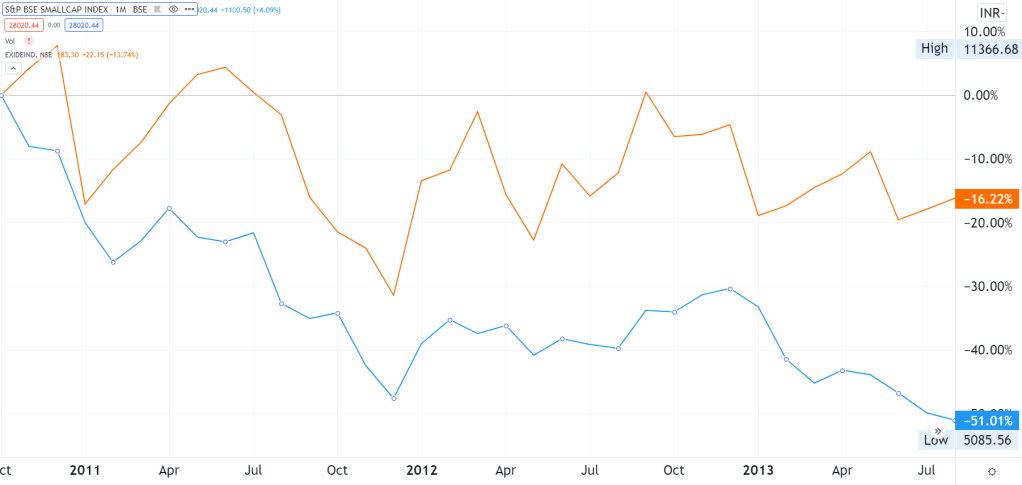
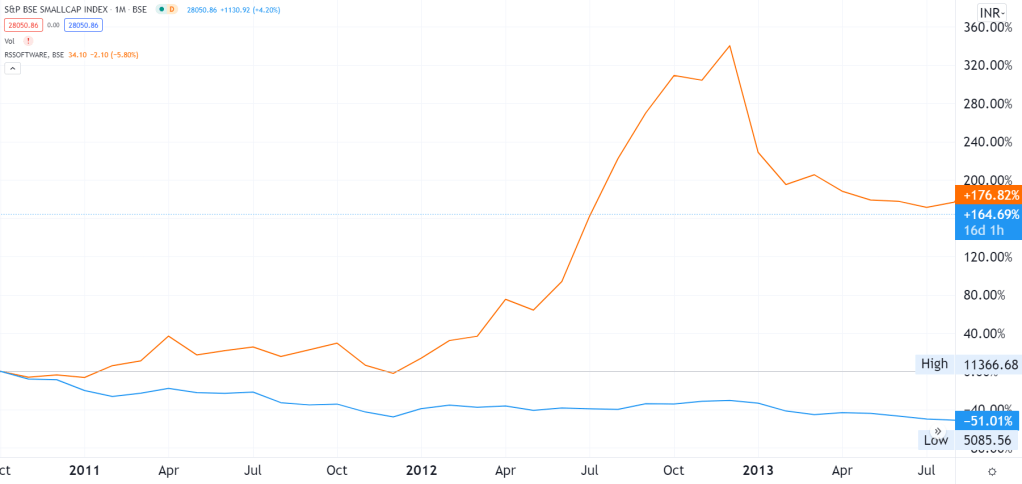
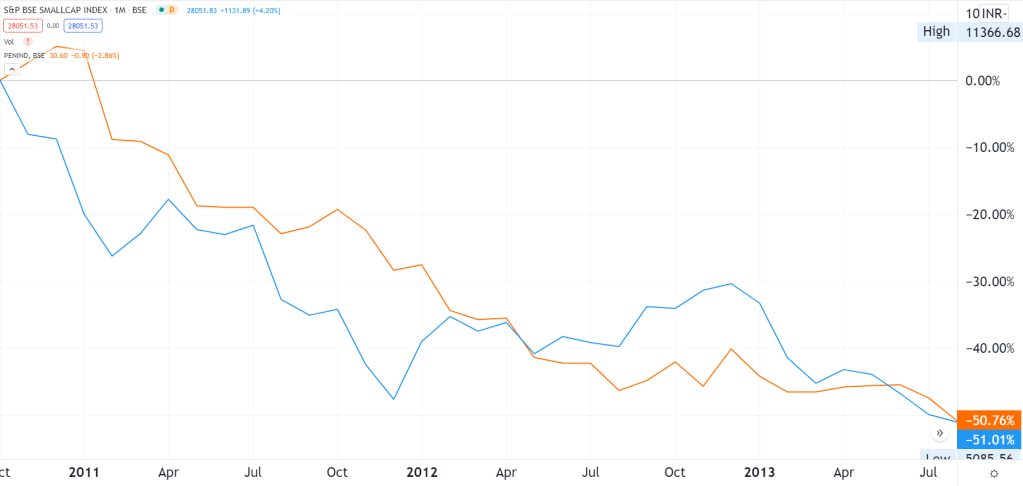
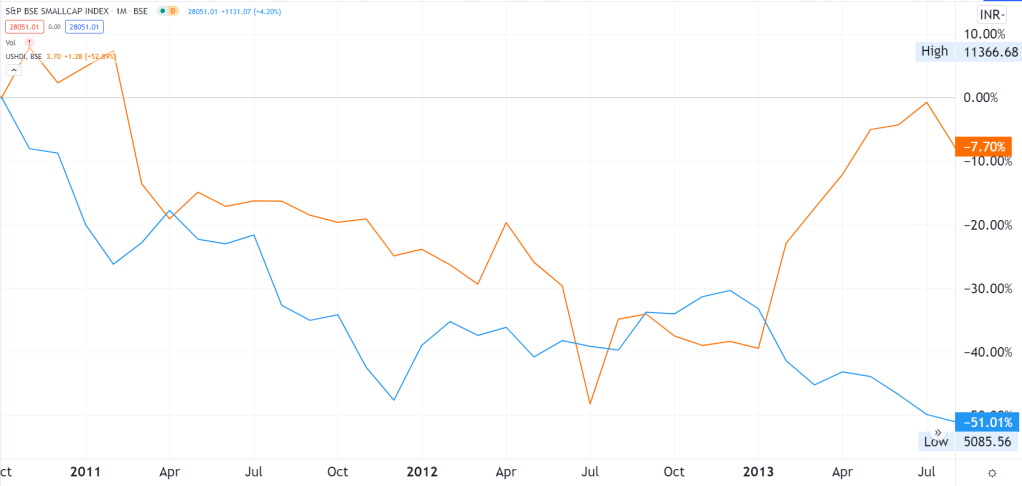
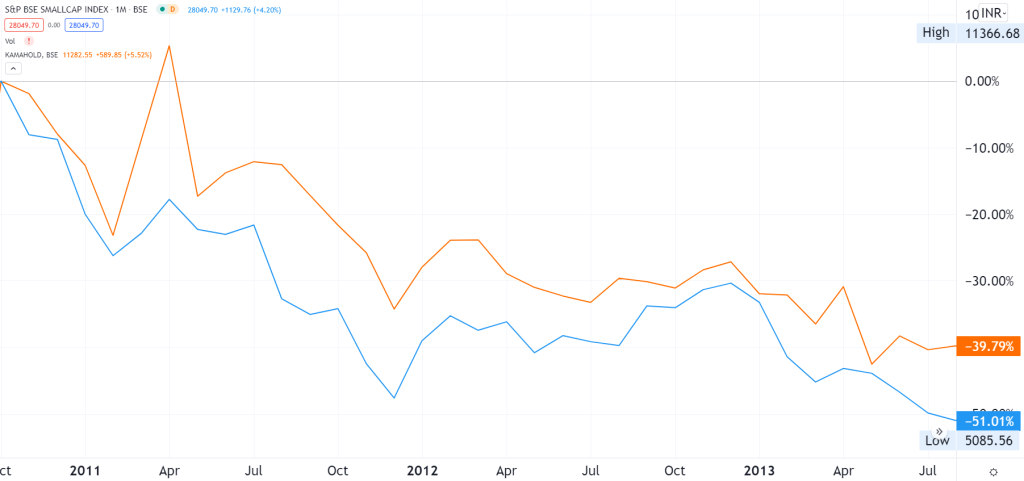
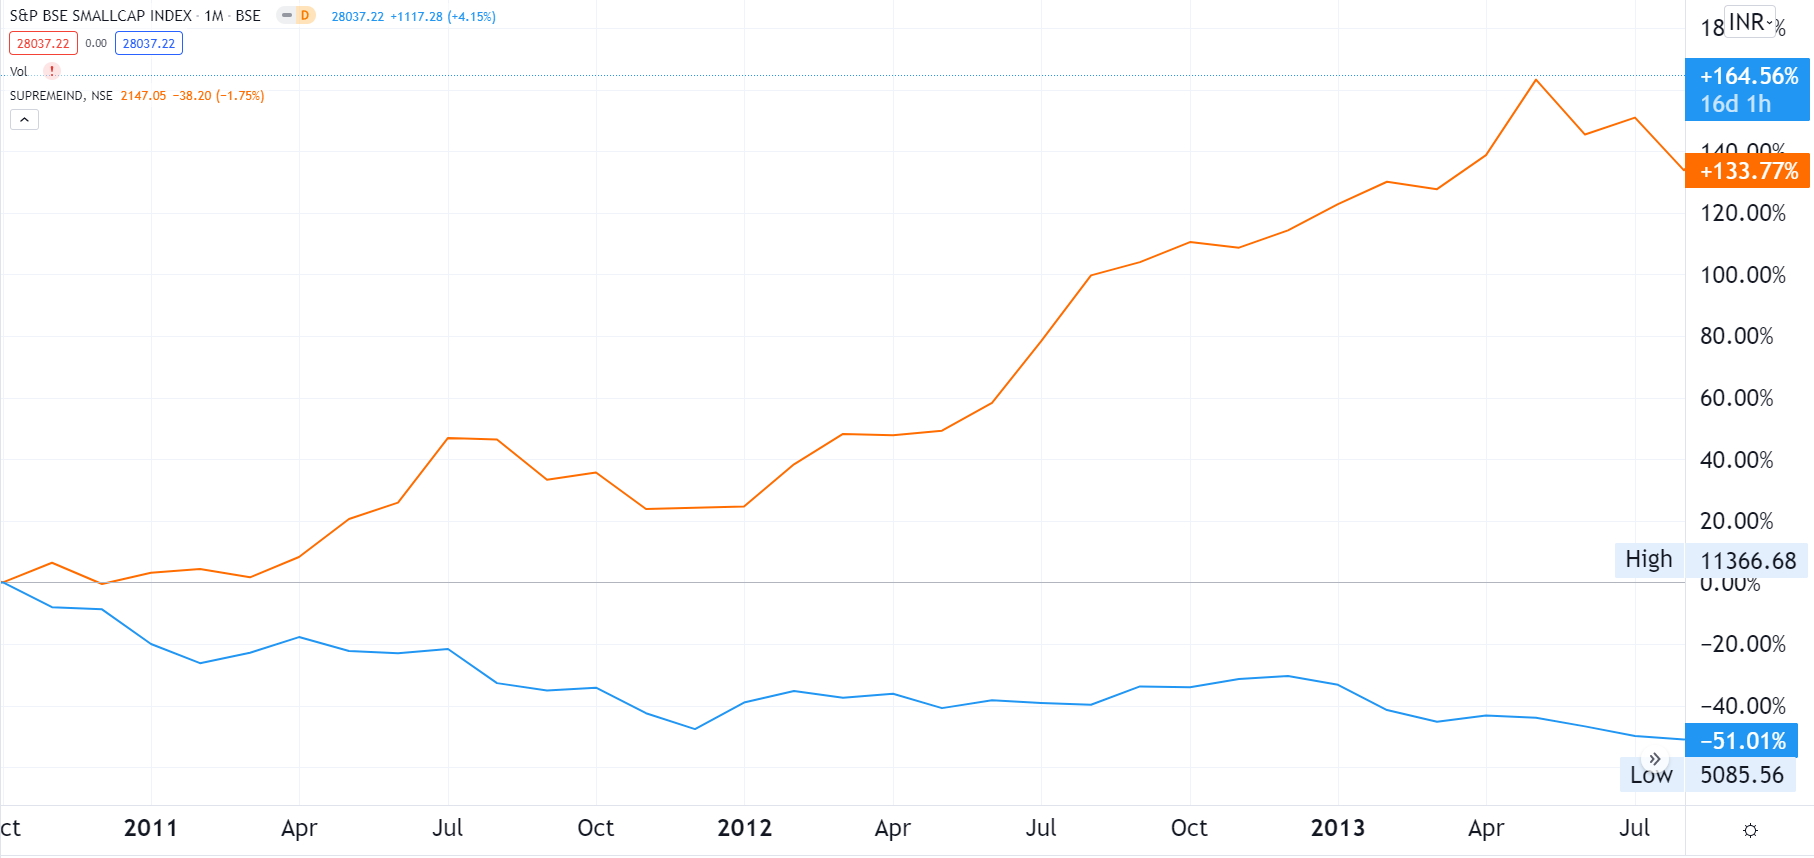
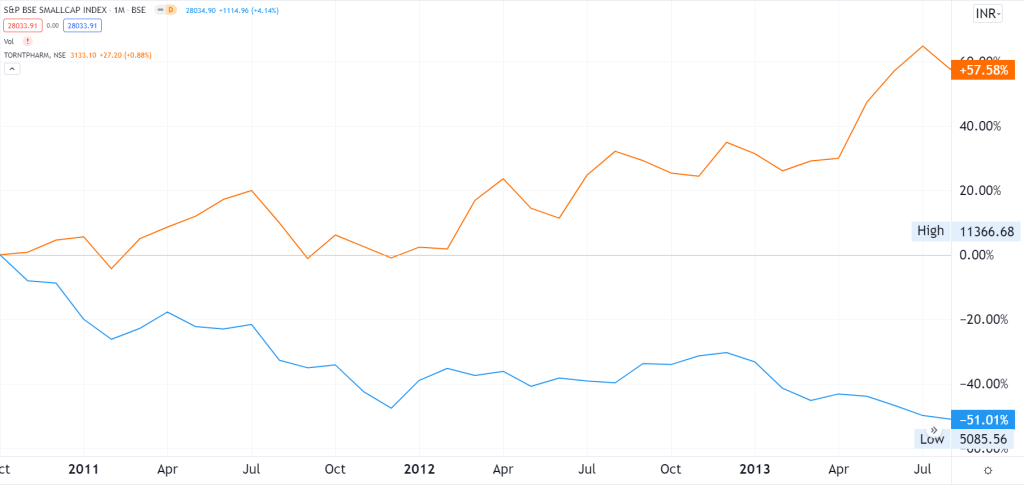
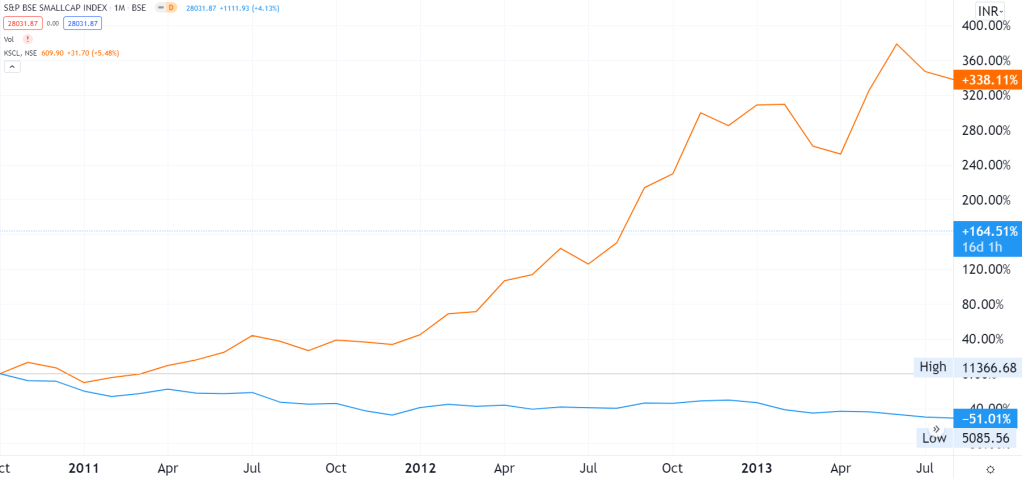
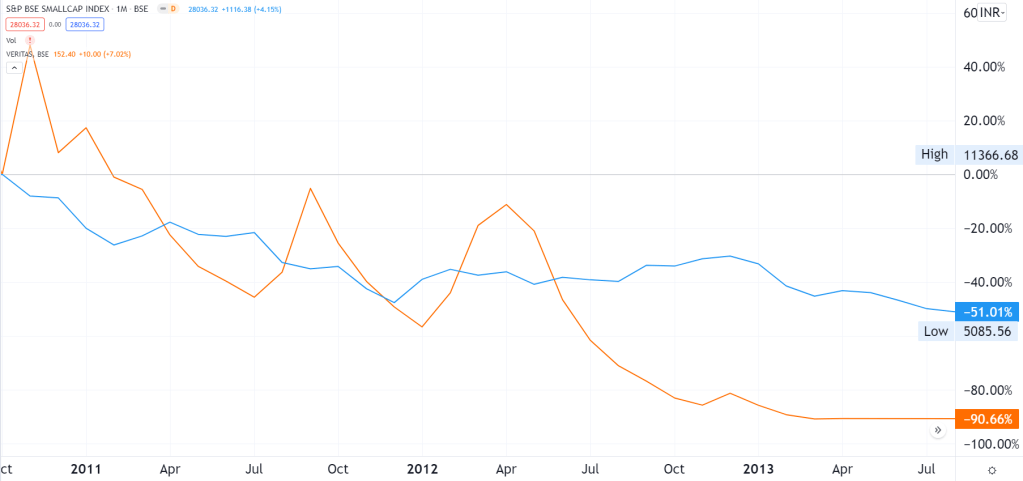
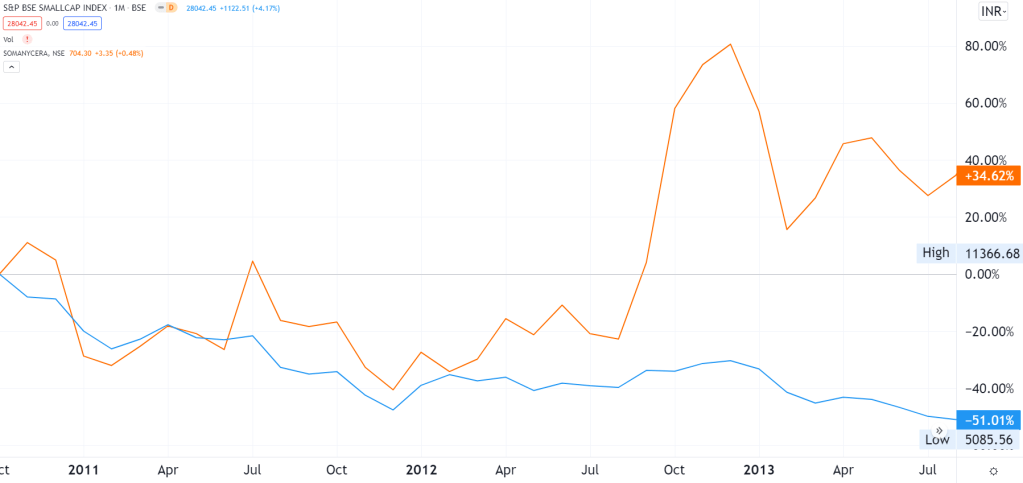
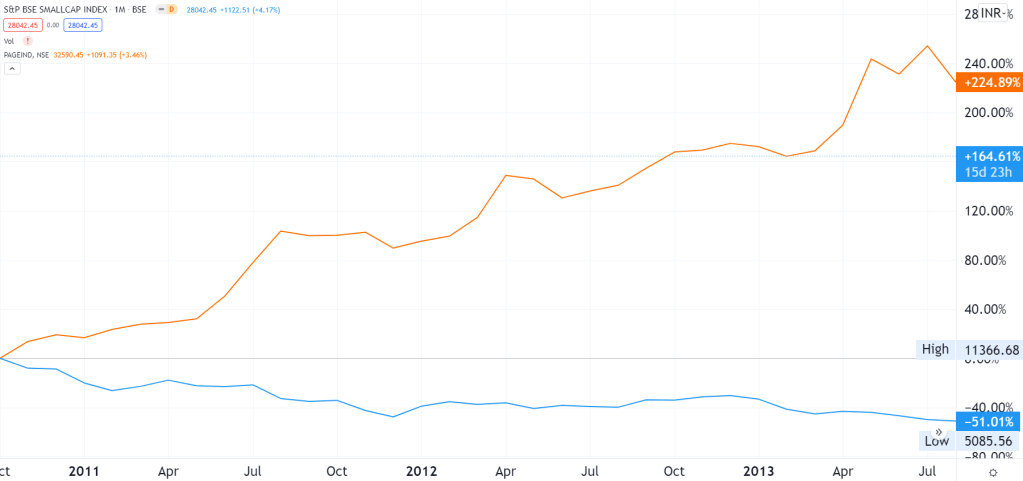
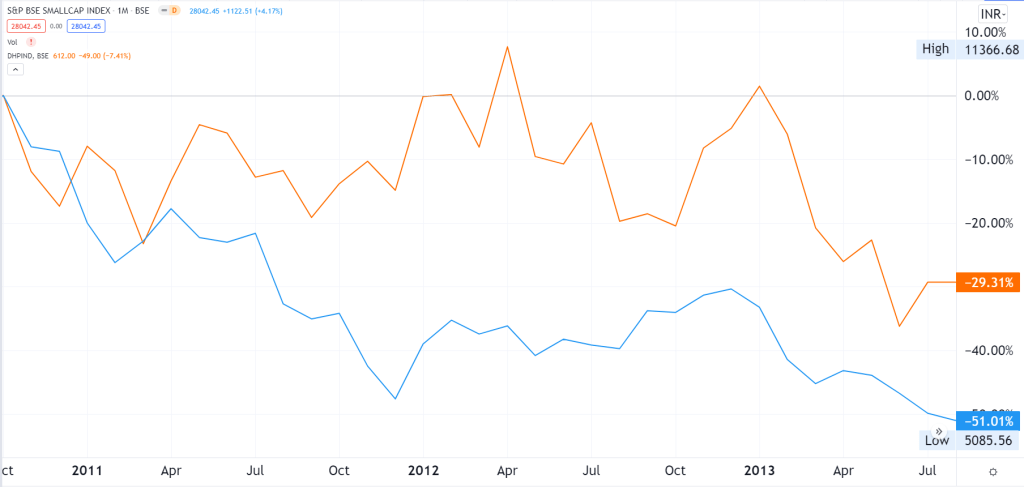
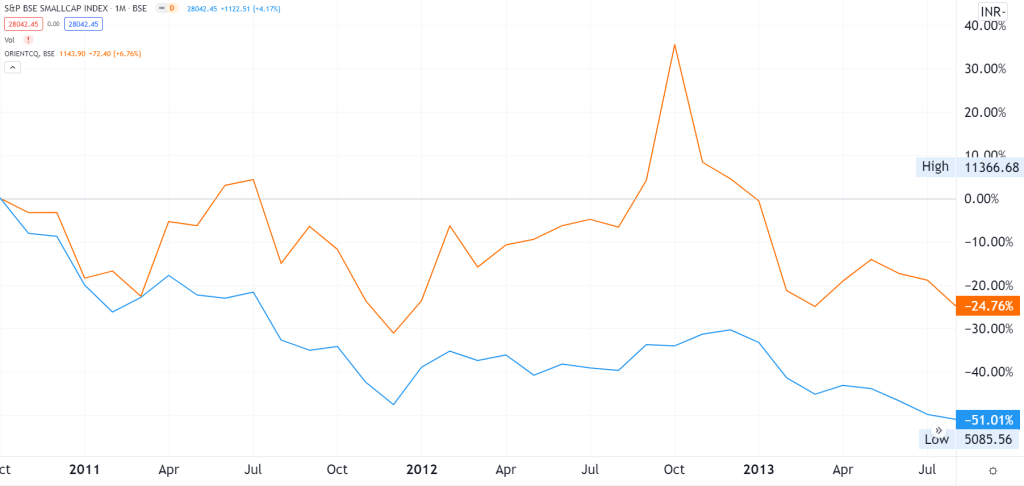
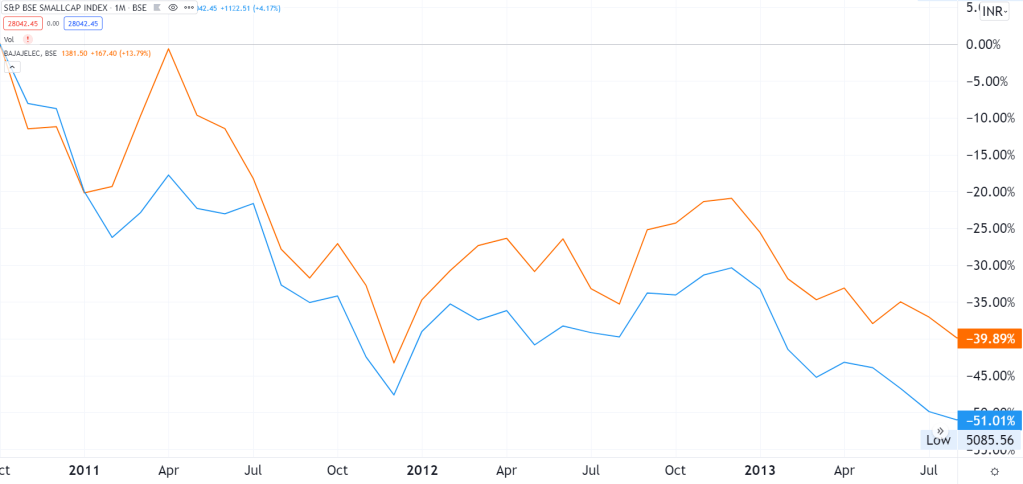
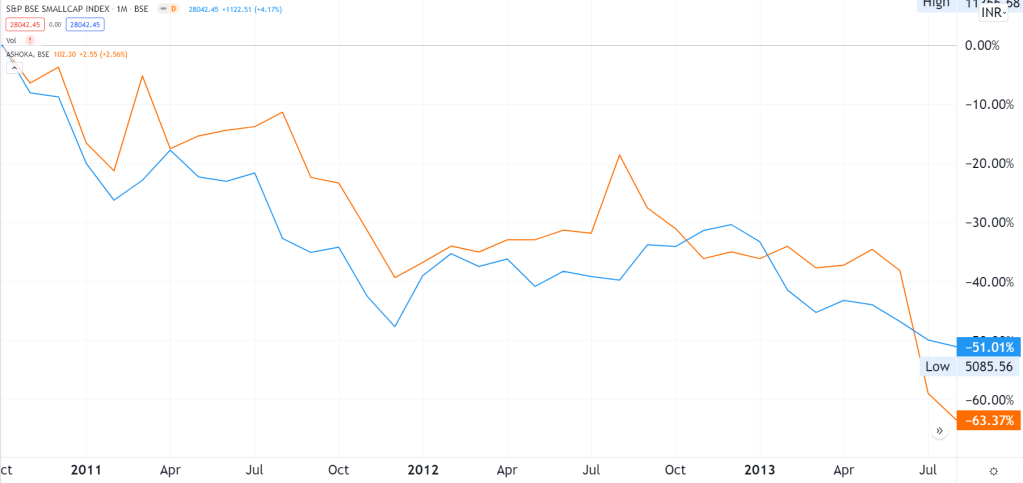
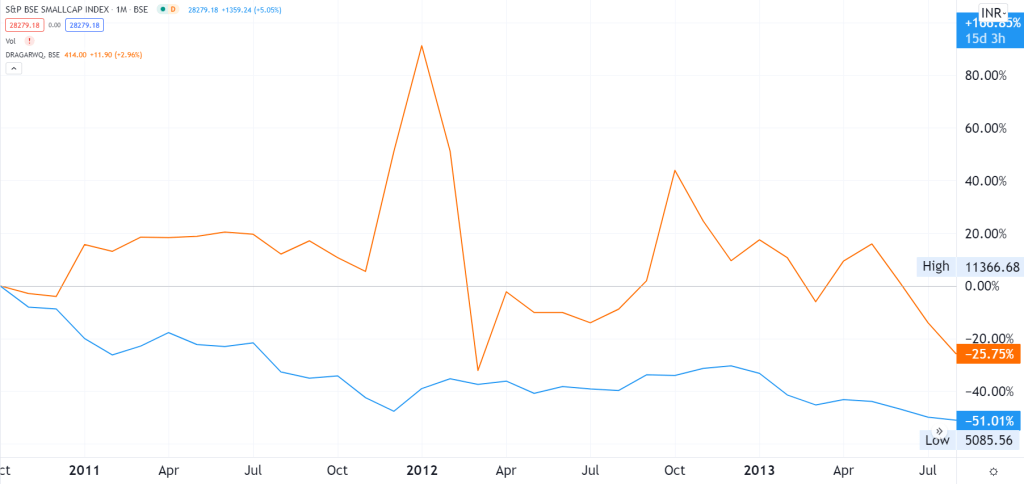
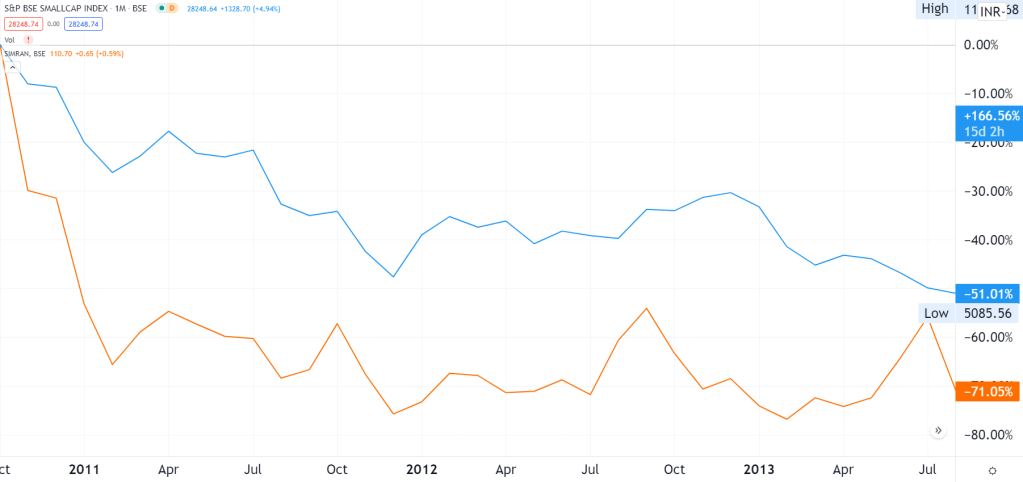
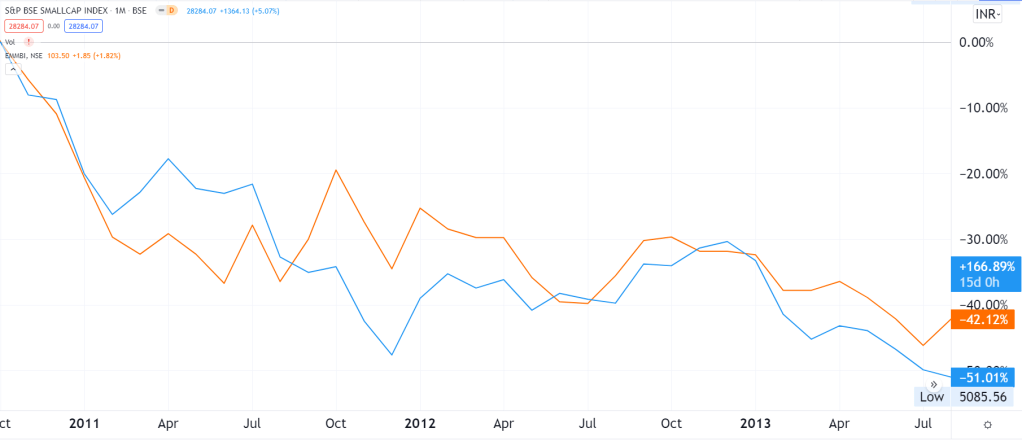
Note: Blue lines in each of the below graphs represent the BSE Small Cap Index while orange lines represent the corresponding stock.
Solar Industries
Estimated Market cap in 2010 – 1124 Crs
Outperformed vs the small cap index
62% absolute returns

Redington India
Estimated Market cap in 2010 – 3671 Crs
Outperformed vs the small cap index
Negative absolute returns

Apollo Hospitals Enterprise
Estimated Market cap in 2010 – 7628 Crs
Outperformed vs the small cap index
69% absolute returns

Va Tech Wabag
Estimated Market cap in 2010 – 2094 Crs
Outperformed vs the small cap index
Negative absolute returns
Cadila Healthcare
Estimated Market cap in 2010 – 16042 Crs
Outperformed vs the small cap index
Negative absolute returns
Vardhman Textile
Estimated Market cap in 2010 – 1977 Crs
Outperformed vs the small cap index
Negative absolute returns

Swaraj Engines
Estimated Market cap in 2010 – 599 Crs
Outperformed vs the small cap index
9% absolute returns

Cera Sanitaryware
Estimated Market cap in 2010 – 238 Crs
Outperformed vs the small cap index
180% absolute returns
Castrol India
Estimated Market cap in 2010 – 12893 Crs
Outperformed vs the small cap index
48% absolute returns

Mayur Uniquoters
Estimated Market cap in 2010 – 171 Crs
Outperformed vs the small cap index
89% absolute returns

Engineers India
Estimated Market cap in 2010 – 10029 Crs
Under performed vs the small cap index
Negative absolute returns
Jenburkt Pharmaceuticals
Estimated Market cap in 2010 – 40 Crs
Outperformed vs the small cap index
Negative absolute returns

Torrent Power
Estimated Market cap in 2010 – 17250 Crs
Under performed vs the small cap index
Negative absolute returns

Exide Industries
Estimated Market cap in 2010 – 14350 Crs
Outperformed vs the small cap index
Negative absolute returns
Indian Toners & Developers
Estimated Market cap in 2010 – 39 Crs
Under performed vs the small cap index
Negative absolute returns

Consolidated Finvest & Holdings
Estimated Market cap in 2010 – 297 Crs
Under performed vs the small cap index
Negative absolute returns

Superhouse
Estimated Market cap in 2010 – 79 Crs
Outperformed vs the small cap index
Negative absolute returns

R S Software (India)
Estimated Market cap in 2010 – 63 Crs
Outperformed vs the small cap index
177% absolute returns
Pennar Industries
Estimated Market cap in 2010 – 782 Crs
Under performed vs the small cap index
Negative absolute returns
Phyto Chem (India)
Estimated Market cap in 2010 – 6 Crs
Outperformed vs the small cap index
60% absolute returns

Narmada Gelatines
Estimated Market cap in 2010 – 41 Crs
Outperformed vs the small cap index
31% absolute returns

Shree Renuka Sugars
Estimated Market cap in 2010 – 21040 Crs
Under performed vs the small cap index
Negative absolute returns

Ushdev International
Estimated Market cap in 2010 – 1429 Crs
Outperformed vs the small cap index
Negative absolute returns
Kama Holdings
Estimated Market cap in 2010 – 352 Crs
Outperformed vs the small cap index
Negative absolute returns
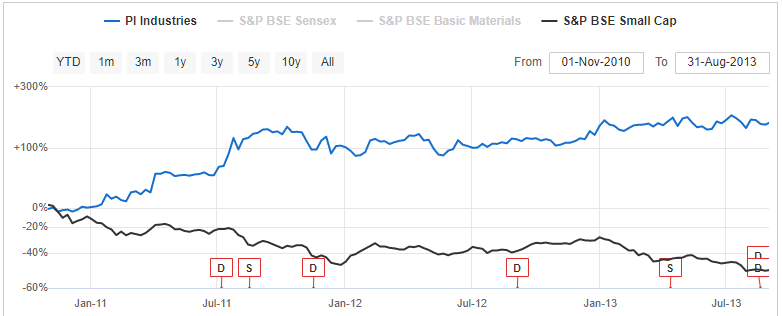
P I Industries
Estimated Market cap in 2010 – 771 Crs
Outperformed vs the small cap index
140% absolute returns
Supreme Industries
Estimated Market cap in 2010 – 2078 Crs
Outperformed vs the small cap index
134% absolute returns
Torrent Pharmaceuticals
Estimated Market cap in 2010 – 4756 Crs
Outperformed vs the small cap index
58% absolute returns
Balaji Amines
Estimated Market cap in 2010 – 164 Crs
Outperformed vs the small cap index
Negative absolute returns

RPG Life Sciences
Estimated Market cap in 2010 – 182 Crs
Outperformed vs the small cap index
Negative absolute returns

Kaveri Seed Company
Estimated Market cap in 2010 – 486 Crs
Outperformed vs the small cap index
338% absolute returns
Veritas (India)
Estimated Market cap in 2010 – 1080 Crs
Under performed vs the small cap index
Negative absolute returns
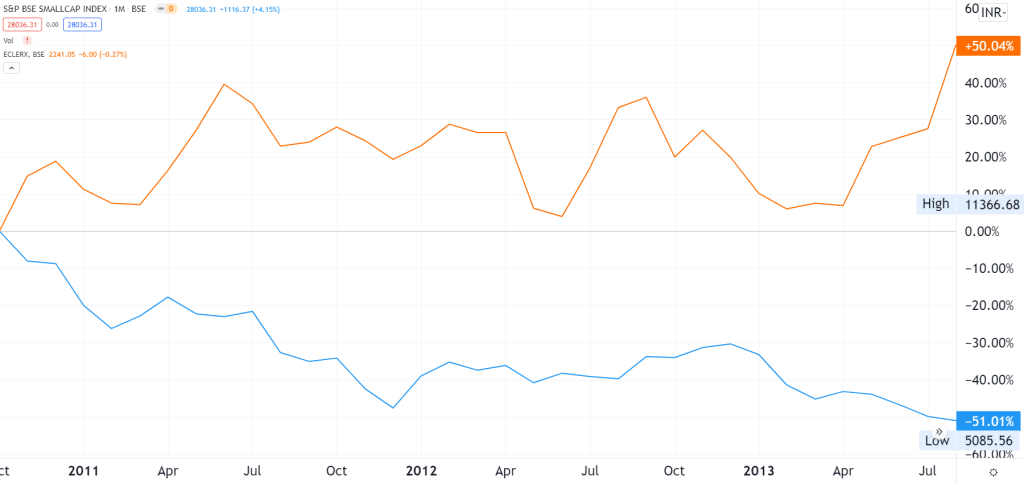
eClerx Services
Estimated Market cap in 2010 – 1872 Crs
Outperformed vs the small cap index
50% absolute returns
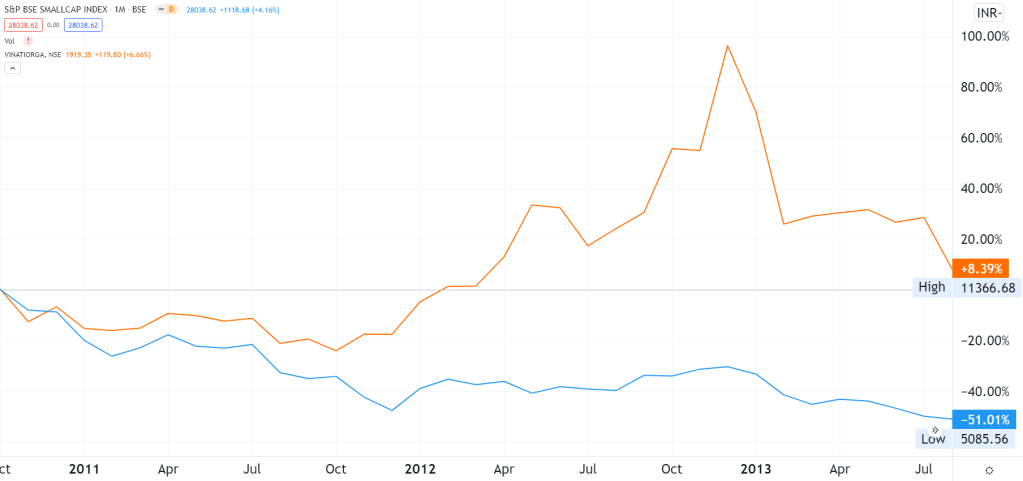
Vinati Organics
Estimated Market cap in 2010 – 411 Crs
Outperformed vs the small cap index
8% absolute returns
Agro Tech Foods
Estimated Market cap in 2010 – 108 Crs
Outperformed vs the small cap index
54% absolute returns
Stylam Industries
Estimated Market cap in 2010 – 28 Crs
Outperformed vs the small cap index
Negative absolute returns

Garware Polyester
Estimated Market cap in 2010 – 641 Crs
Under performed vs the small cap index
Negative absolute returns

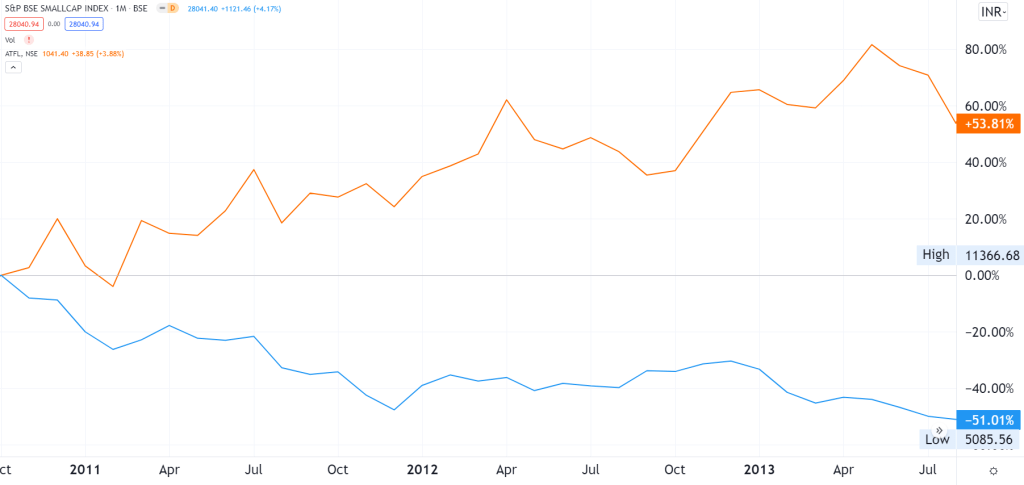
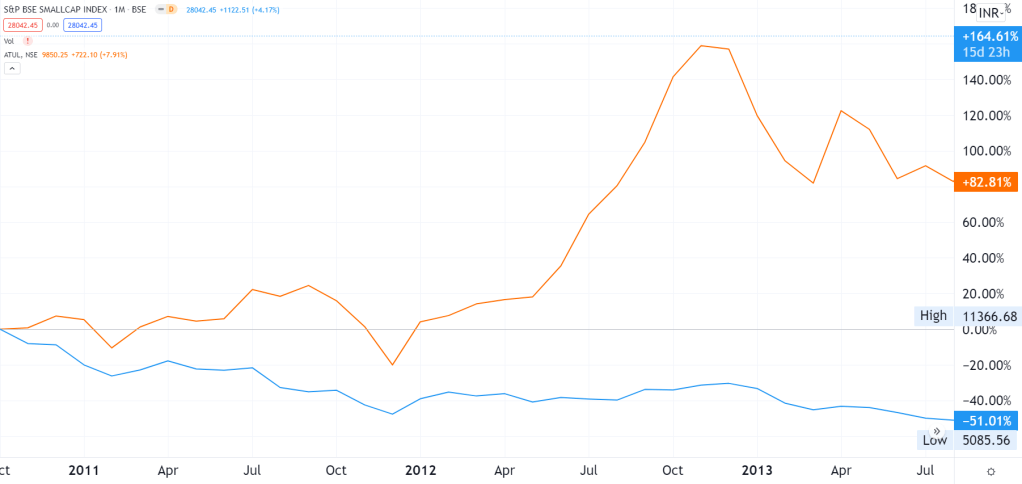
Atul Ltd
Estimated Market cap in 2010 – 579 Crs
Outperformed vs the small cap index
83% absolute returns
Somany Ceramics
Estimated Market cap in 2010 – 286 Crs
Outperformed vs the small cap index
35% absolute returns
Vidhi Specialty Food Ingredients
Estimated Market cap in 2010 – 21 Crs
Outperformed vs the small cap index
Negative absolute returns

Page Industries
Estimated Market cap in 2010 – 1565 Crs
Outperformed vs the small cap index
225% absolute returns
Thangamayil Jewellery
Estimated Market cap in 2010 – 240 Crs
Outperformed vs the small cap index
12% absolute returns

DHP India
Estimated Market cap in 2010 – 11 Crs
Outperformed vs the small cap index
Negative absolute returns
Sudarshan Chemical Industries
Estimated Market cap in 2010 – 468 Crs
Outperformed vs the small cap index
Negative absolute returns

Oriental Carbon & Chemicals
Estimated Market cap in 2010 – 142 Crs
Outperformed vs the small cap index
Negative absolute returns
Bajaj Electricals
Estimated Market cap in 2010 – 3640 Crs
Outperformed vs the small cap index
Negative absolute returns
DFM Foods
Estimated Market cap in 2010 – 106 Crs
Outperformed vs the small cap index
138% absolute returns

Ashoka Buildcon
Estimated Market cap in 2010 – 1994 Crs
Under performed vs the small cap index
Negative absolute returns
Manali Petrochemicals
Estimated Market cap in 2010 – 312 Crs
Outperformed vs the small cap index
Negative absolute returns

BASF India
Estimated Market cap in 2010 – 3023 Crs
Outperformed vs the small cap index
Negative absolute returns

India Motor Parts & Accessories
Estimated Market cap in 2010 – 303 Crs
Outperformed vs the small cap index
19% absolute returns

Gravita India
Estimated Market cap in 2010 – 351 Crs
Under performed vs the small cap index
Negative absolute returns

HSIL
Estimated Market cap in 2010 – 278 Crs
Outperformed vs the small cap index
Negative absolute returns

Caprihans India
Estimated Market cap in 2010 – 278 Crs
Outperformed vs the small cap index
Negative absolute returns

Dr Agarwals Eye Hospital
Estimated Market cap in 2010 – 40 Crs
Outperformed vs the small cap index
Negative absolute returns
Triton Valves
Estimated Market cap in 2010 – 103 Crs
Under performed vs the small cap index
Negative absolute returns

Simran Farms
Estimated Market cap in 2010 – 29 Crs (Can be considered a penny stock)
Under performed vs the small cap index
Negative absolute returns
Ramky Infrastructure
Estimated Market cap in 2010 – 2568 Crs
Under performed vs the small cap index
Negative absolute returns

Josts Engineering Company
Estimated Market cap in 2010 – 35 Crs
Outperformed vs the small cap index
Negative absolute returns

DIC India
Estimated Market cap in 2010 – 305 Crs
Outperformed vs the small cap index
Negative absolute returns

Educomp Solutions
Estimated Market cap in 2010 – 7708 Crs
Under performed vs the small cap index
Negative absolute returns

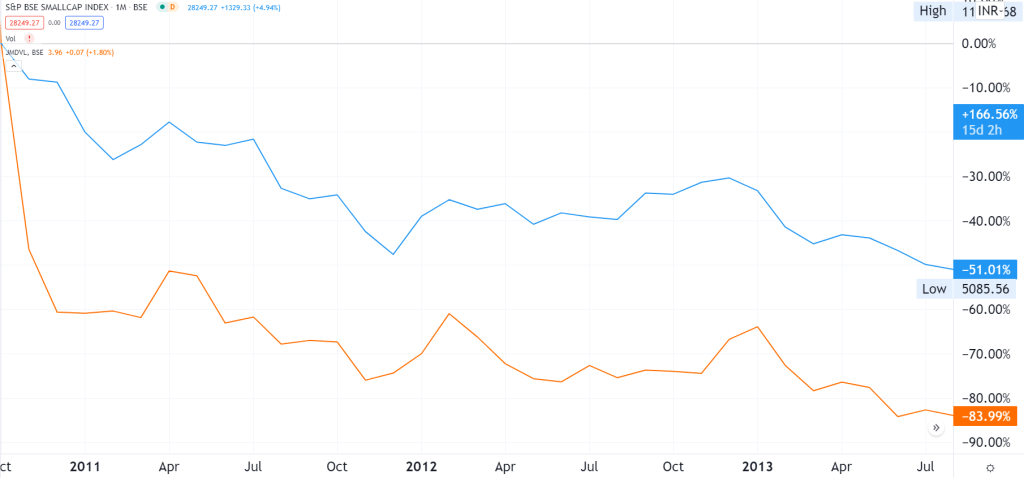
JMD Ventures
Estimated Market cap in 2010 – 297 Crs
Under performed vs the small cap index
Negative absolute returns
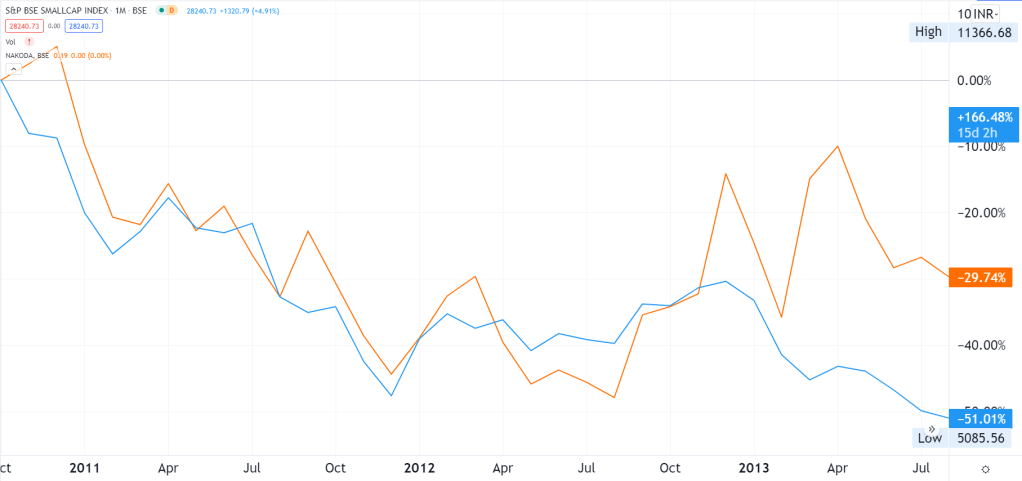
Nakoda Ltd
Estimated Market cap in 2010 – 570 Crs
Outperformed vs the small cap index
Negative absolute returns
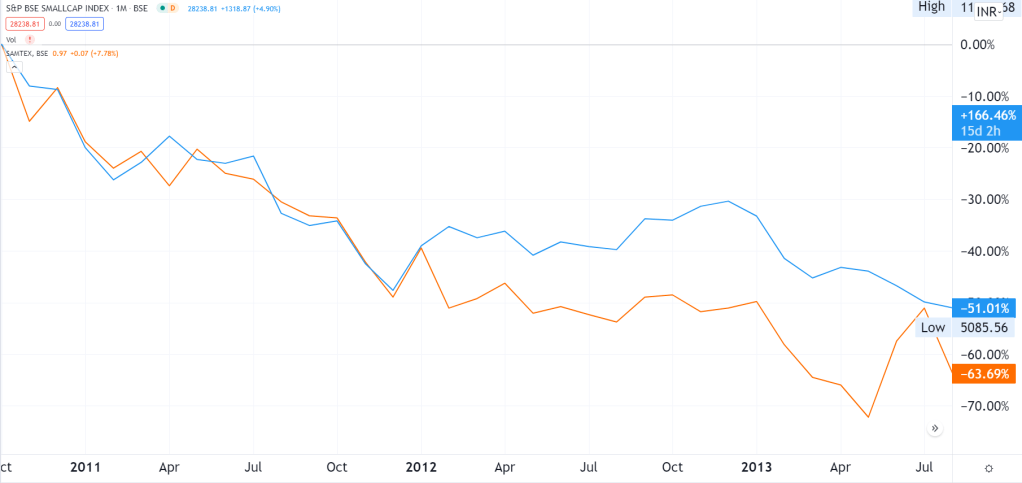
Samtex Fashions
Estimated Market cap in 2010 – 53 Crs (Penny stock)
Under performed vs the small cap index
Negative absolute returns
SEL Manufacturing Company
Estimated Market cap in 2010 – 2 Crs (Penny stock)
Under performed vs the small cap index
Negative absolute returns

Silver Oak (India) Ltd
Estimated Market cap in 2010 – 6 Crs (Penny stock)
Outperformed vs the small cap index
10% absolute returns

Technofab Engineering
Estimated Market cap in 2010 – 192 Crs
Under performed vs the small cap index
Negative absolute returns

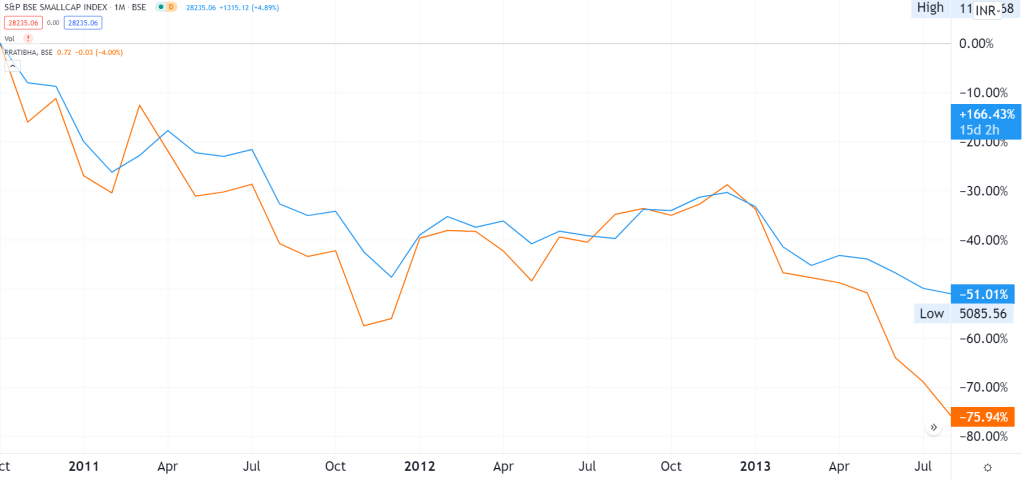
Pratibha Industries
Estimated Market cap in 2010 – 1912 Crs
Outperformed vs the small cap index
Negative absolute returns
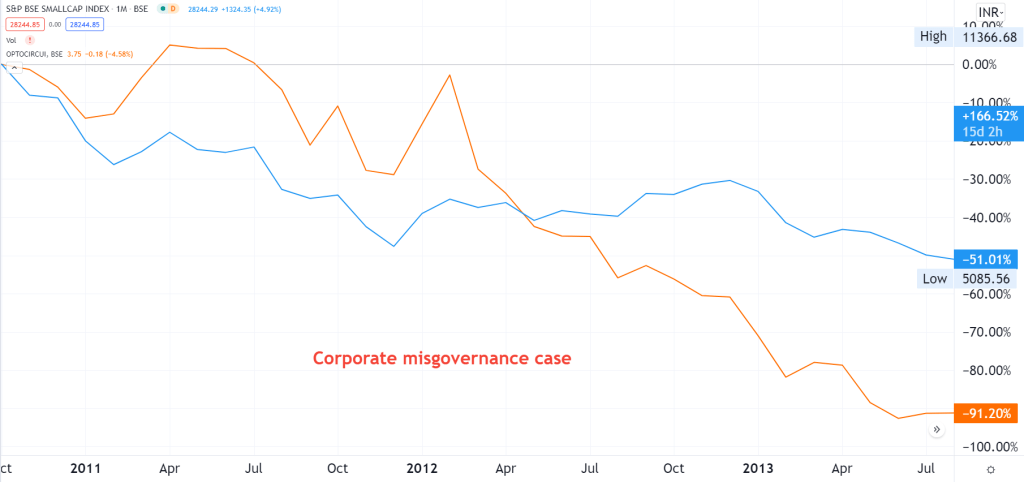
Opto Circuits (India)
Estimated Market cap in 2010 – 7063 Crs
Outperformed vs the small cap index
Negative absolute returns
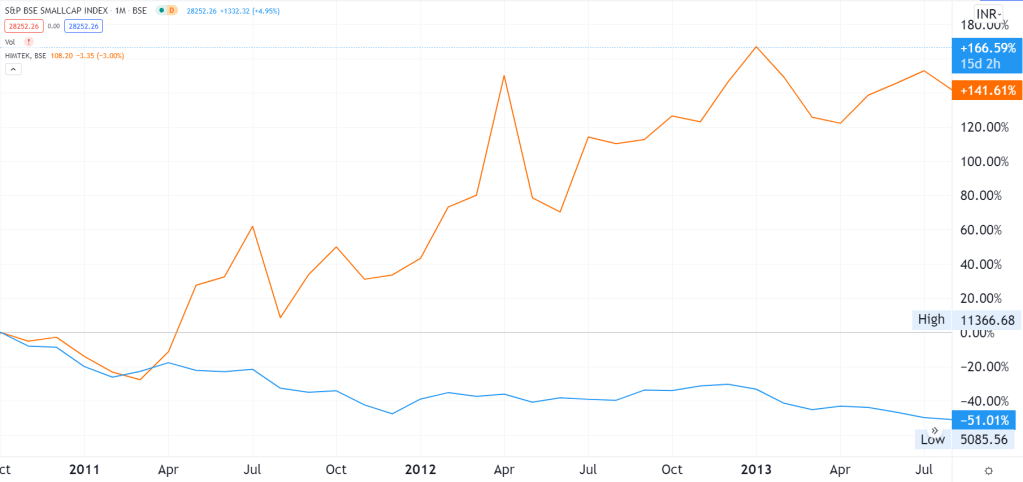
Him Teknoforge
Estimated Market cap in 2010 – 84 Crs
Outperformed vs the small cap index
142% absolute returns
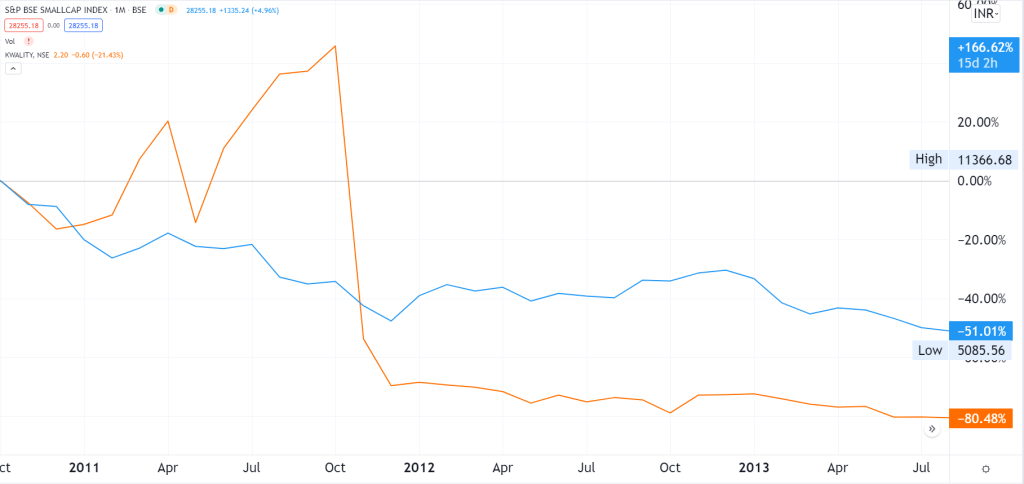
Kwality Ltd
Estimated Market cap in 2010 – 3084 Crs
Outperformed vs the small cap index
Negative absolute returns due to suspected operator manipulation in the stock
IRB Infrastructure Developers
Estimated Market cap in 2010 – 3084 Crs
Outperformed vs the small cap index
Negative absolute returns

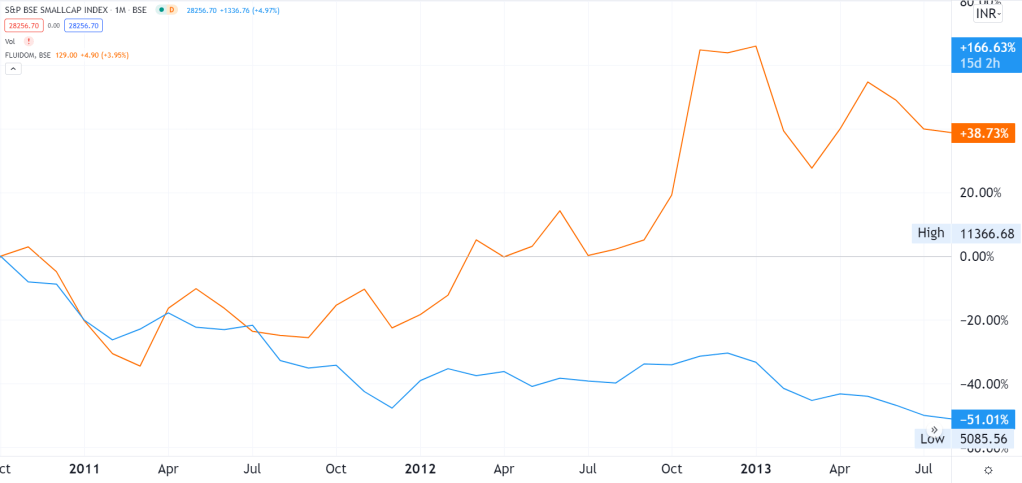
Fluidomat
Estimated Market cap in 2010 – 25 Crs
Outperformed vs the small cap index
39% absolute returns
Garden Silk Mills
Estimated Market cap in 2010 – 619 Crs
Under performed vs the small cap index
Negative absolute returns

Simplex Castings
Estimated Market cap in 2010 – 73 Crs
Under performed vs the small cap index
Negative absolute returns

Sacheta Metals
Estimated Market cap in 2010 – 154 Crs
Under performed vs the small cap index
Negative absolute returns

Mahalaxmi Rubtech
Estimated Market cap in 2010 – 417 Crs
Under performed vs the small cap index
Negative absolute returns

ARSS Infrastructure Projects
Estimated Market cap in 2010 – 3006 Crs
Under performed vs the small cap index
Negative absolute returns

Supreme Infrastructure India
Estimated Market cap in 2010 – 748 Crs
Outperformed vs the small cap index
Negative absolute returns
Inani Marbles & Industries
Estimated Market cap in 2010 – 44 Crs
Outperformed vs the small cap index
20% absolute returns

Jindal Hotels
Estimated Market cap in 2010 – 45 Crs
Under performed vs the small cap index
Negative absolute returns

Emmbi Industries
Estimated Market cap in 2010 – 39 Crs
Outperformed vs the small cap index
Negative absolute returns
Paramount Cosmetics
Estimated Market cap in 2010 – 20 Crs
Under performed vs the small cap index
Negative absolute returns

MBL Infrastructures
Estimated Market cap in 2010 – 1446 Crs
Under performed vs the small cap index
Negative absolute returns

XPRO India
Estimated Market cap in 2010 – 1446 Crs
Under performed vs the small cap index
Negative absolute returns

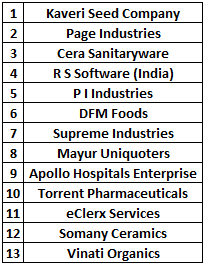
25 stocks that gave positive returns until 2013, despite the small cap index being half of what it was in 2010.

What was different between the companies that outperformed the index vs the ones that didn’t?
Here’s some data to chew.
13 Companies grew their sales by more than 15% throughout 2011, 2012 & 2013.
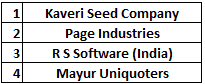
4 companies grew their profits by more than 15% throughout 2011, 2012 & 2013.
22 out of 25 companies had above average ROEs, throughout.
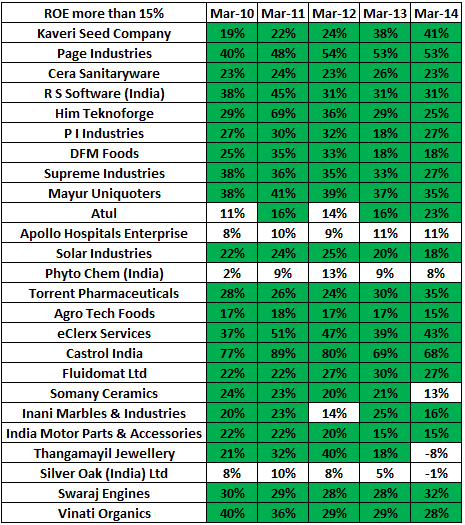
Now, some of the above companies might have had ongoing capacity expansion projects which might have optically suppressed their ROEs. Yet, these companies’ businesses and stocks continued to do well in what was perceived to be the worst possible time to get into small caps, in many years.
Let’s try some dis-confirming evidence now. First some data.
Total # of companies (small & mid cap) that grew PAT by at least 15% YoY in that period 95
Total # of companies that outperformed 25
Total # of companies that under performed 59
Total # of companies excluded due to corporate actions / lack of data 11
Did any of the companies that showed negative returns, have an ROE of 15% consistently? None. Zero.
Did any of the companies that showed negative returns, have consistent growth of more than 15% per annum? Again, the answer is no.
This would mean that ROE & growth are the engines which drive stock prices.
How can we make this study better?
If you have suggestions on how we can make this study better and as bias-free as possible, please drop me a note at barath@bigvisioninvesting.com or in the comments box below and I’ll try to see how best we can incorporate it.
Conclusions thus far:
- Businesses (and stocks) can do well despite all odds. Imagine the pain you’d have gone through, had you sold one of the out-performers because of all the market related noise in the media, thereby trying to time the market.
- Stock prices are driven by growth, ROE (& the US Fed) in the long run. And stocks of businesses which tick both boxes can do well, in the worst possible market conditions.
- Focus more on the business is doing than on what the market indices will do.
I will do a similar blog for the next small cap cycle which happened from Jan 2018 to Mar 2020 (chart below), just to find out if these conclusions hold good in another time frame. Stay tuned.

Barath Mukhi
28-Sep-2021

Good article
Waiting to read the 2018 to 2020 study
Amey Kulkarni Candor Investing https://candorinvesting.com/ https://www.linkedin.com/in/amey153/
On Tue, Sep 28, 2021 at 2:16 PM Big Vision Investing wrote:
> Barath Mukhi posted: ” I recently revisited an interview by Mr. Raamdeo > Agrawal, where he said “I am very happy when the markets fall and I can buy > something that adds more value to my portfolio. Markets don’t understand > high quality value in the short term. Focusing on value ” >
LikeLike