Blogs

Featured

Could Alembic Pharma be the next Pharma Multibagger?

Blog on Alembic Pharma – May 2020

Every crisis brings with it, changes, and some of those changes spell OPPORTUNITY. Of course, not all opportunities pan out the way we intend them to. But what if we manage to ride one such opportunity and manage to benefit from it.

This is my first attempt to understand a Pharma business and I started deep diving only after the Covid19 situation started evolving, since I thought it might be a good idea to expose my clients’ portfolios to fast growing companies from an industry which is basically, recession proof. It would be fair to say I am quite new to this industry and have been trying to understand a very complex business. On the other hand, from my interactions with several value investors, over the years, Pharma as a sector, is a black box in a lot of value investors’ minds, due to the complexity involved, and that exactly, makes it a bias worth exploiting.

The purpose of this post is to be able to come back a few years later, do a post-mortem and understand what worked and what didn’t. My views are biased and what follows is, how I look at the situation today. My opinions could change rapidly, depending upon how internal and external factors play out over time.

On 21st March, Donald Trump tweeted this.

There are quite a few listed companies that produce Hydroxychloroquine & Azithromycin. So here’s what differentiates Alembic Pharmaceuticals, a company that I started investing in, in Sep 2019. My initial reason for buying was the company was growing well, was run by a fantastic management team and the price was attractive, given the growth numbers.

What the company sells..

What are Generics / Generic Drugs?

Generic drugs have a similar chemical composition as branded drugs. They are accepted globally and are of the same quality with a lesser cost as compared to branded drugs. Along with no compromise on quality, they are also cost-effective as the cost of R&D and drug discovery is not included in the case of generic drugs.

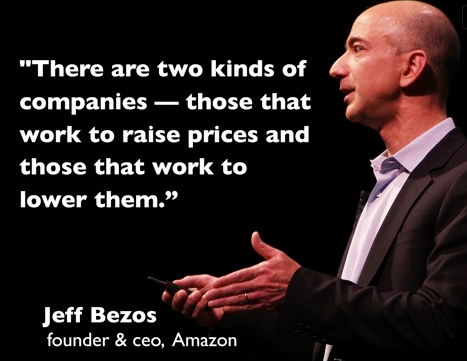
Generic drug manufacturers like Alembic fall in the latter category because they help reduce prices of essential drugs vs companies like Valeant Pharmaceuticals which work to increase prices. We all know what happened to Valeant and some of it’s very savvy investors, a few years ago.

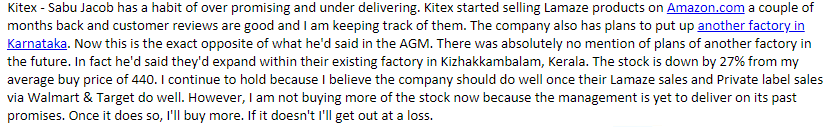
Below is an old news article that shows staggering price differences between Generic & Branded drugs

An old article shows Pharma Firms Sell Common Drugs At 10 Times The Cost: MCA

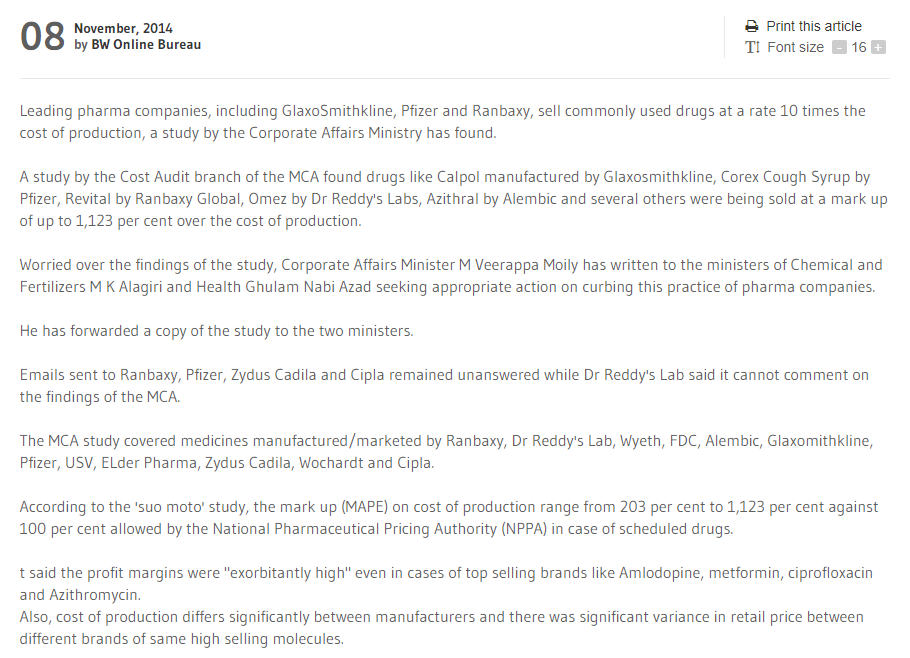
And here’s what happens when a company creates win-win situations for itself and it’s customers, by selling drugs at a fraction of the prices that branded drugs sell at. The company wins by increased sales and customers are happy to buy the same unbranded drugs at unbelievably low prices.

Contribution of US Generics business to Alembic’s overall sales is increasing

Branded drugs – A company develops a drug over several years, secures approvals from FDA or equivalent regulatory bodies, secures patents for it and then milks the cow. Medical patents typically last for 17-20 years after which other companies are legally allowed to manufacture the same drug using the same ingredients. Since the company manufacturing the generic drug, has not incurred R&D and related costs, it sells the drug at a fraction of the branded drug’s prices.
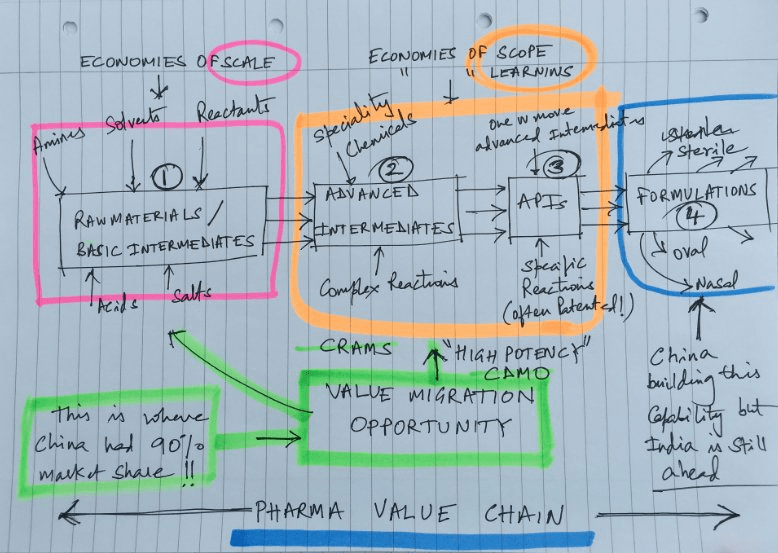
API Business

API (Active Pharmaceutical Ingredient) means the active ingredient which is contained in a drug. API and raw materials are often confused due to similar usage of the two terms. An API is not made by only one reaction from the raw materials but rather it becomes an API via several chemical compounds. In layman terms, Medicines are composed of APIs, and APIs, in turn, are composed of raw materials that go through various manufacturing processes before they turn into APIs. To give you an analogy, let’s take Coca Cola.

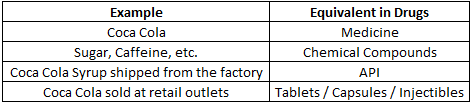
Peter Lynch once said “When there’s a war going on, don’t buy the companies that are doing the fighting; buy the companies that sell the bullets.” In the current context of war against the virus, one can equate APIs with bullets being used to fight the war against Coronavirus. Effectively, Alembic is fighting the war (through their Azithromycin drug) as well as supplying the bullets (APIs) to MNCs like Pfizer.

Icing on the cake – Azithromycin shortage in the USA & other countries

As per the US FDA website, there has been continuous shortage for Azithromycin all the way until 8th May, 2020 and the shortage continues as of the time of writing this blog. Only 3 companies out of 10, seem to be in a position, to supply the drug. And because, Alembic manufactures the API as well as the end product, it seems to be better placed to continue supplying the drug vs it’s competitors.

Alembic has the capacity to manufacture 10 Crore tablets a month. Retail price in the USA is between ₹120 & ₹174 per tablet. This price does not exclude retailer / distributor’s margins and how much of an upside this situation brings for Alembic, is hence open for debate. I believe there could be significant upside from this opportunity for the company, this year, and leave it to your judgement as to how much of an upside there is.
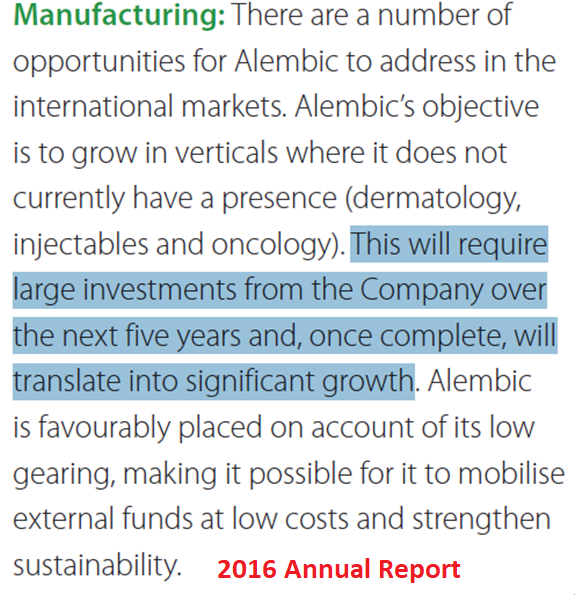
Capacity expansion

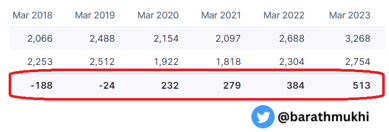
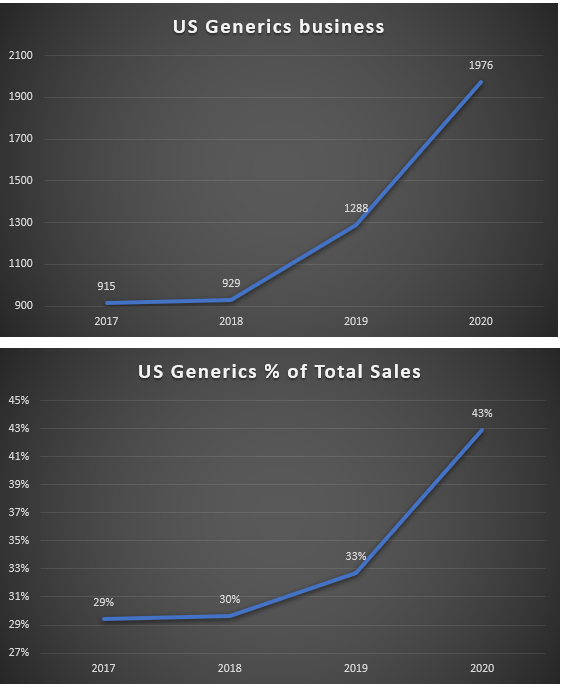
The company has been investing a good chunk into expanding their production capacity and this should take care of the next leg of growth for the company. The company’s balance sheet shows Capital work in progress has grown by 17x between 2016 & 2020. Sales has grown by 1.5x during the same period.

Potential to increase sales per rupee of assets, from 1.4 in FY2020 to a higher number, once the company starts monetizing the R&D & Capex spends it has done over the last 3-4 years

There is no denying that the company is capitalizing some of it’s R&D and related costs. On the other hand, the purpose of the above graph is to roughly understand what kind of an upside potential there could be. Before the company started expanding capacity in 2016, it used to have sales of ₹4 for every ₹ of Fixed assets and CWIP. Even if we were to assume, the company moves to ₹2.5 of sales for every ₹ of fixed assets and CWIP, coupled with increased assets in the future, from the current ₹1.4, the upside could be significant.

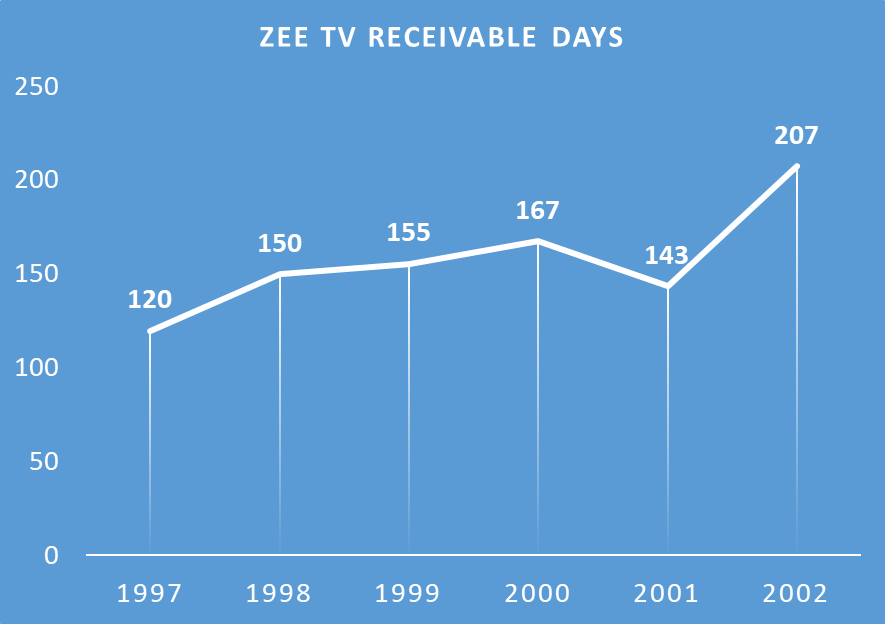
Earnings quality check

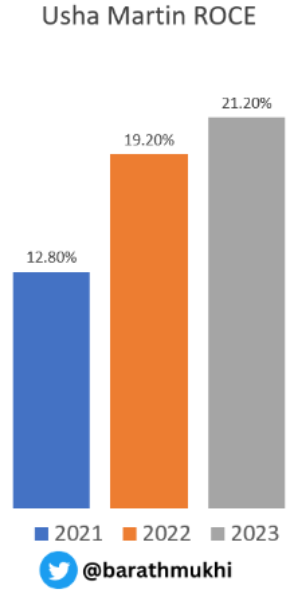
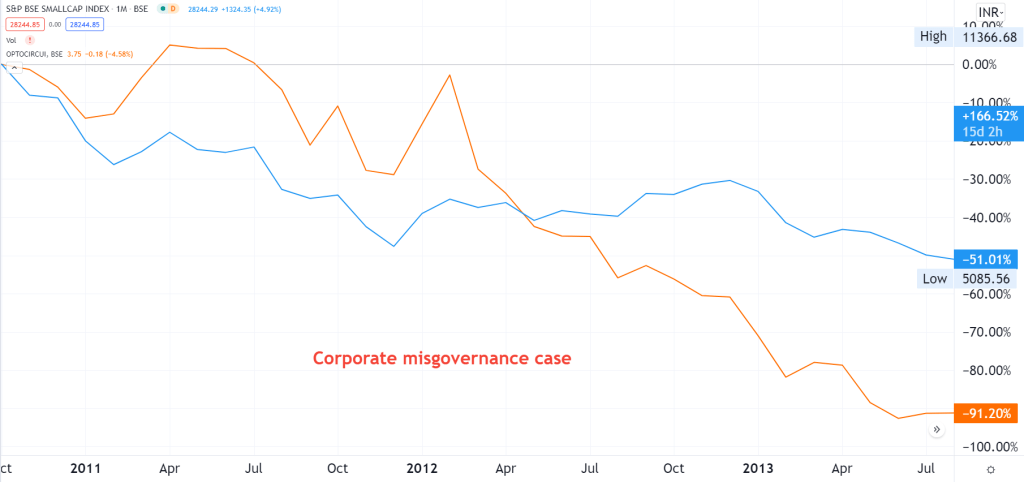
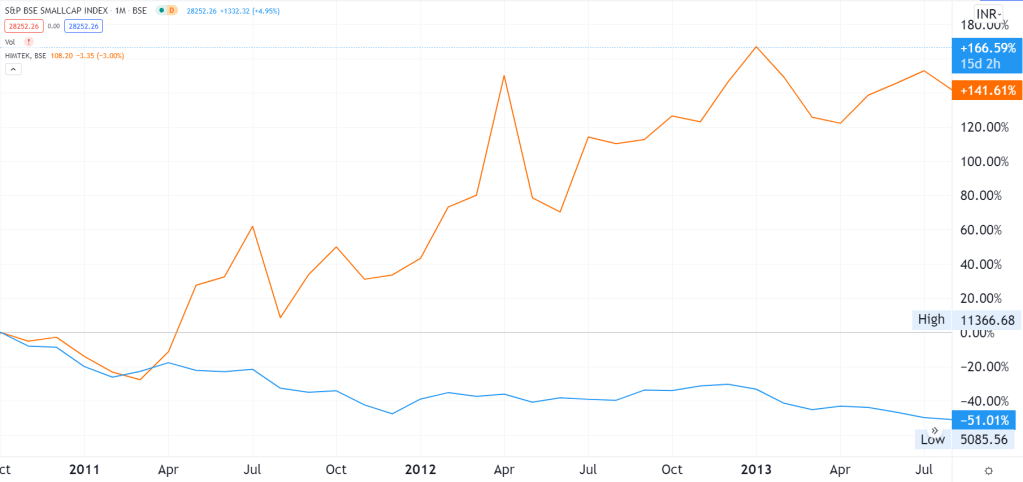
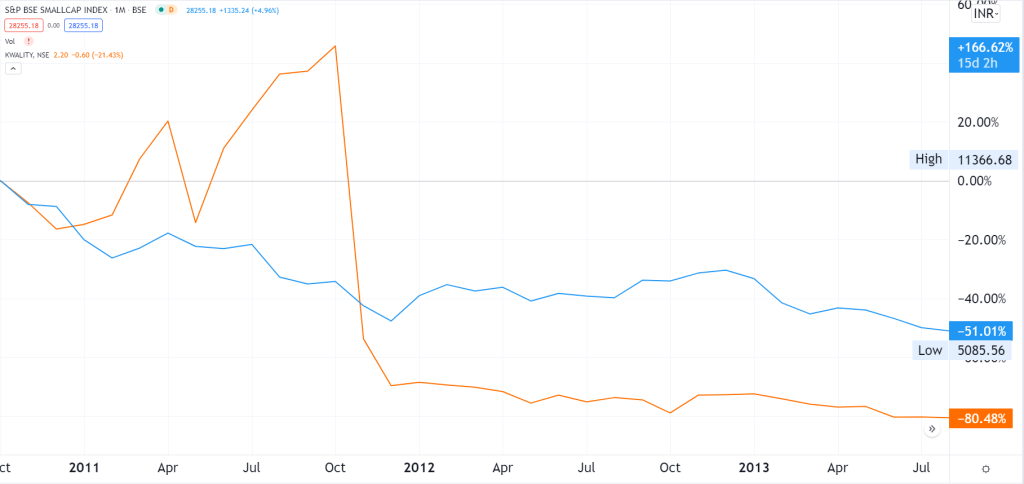
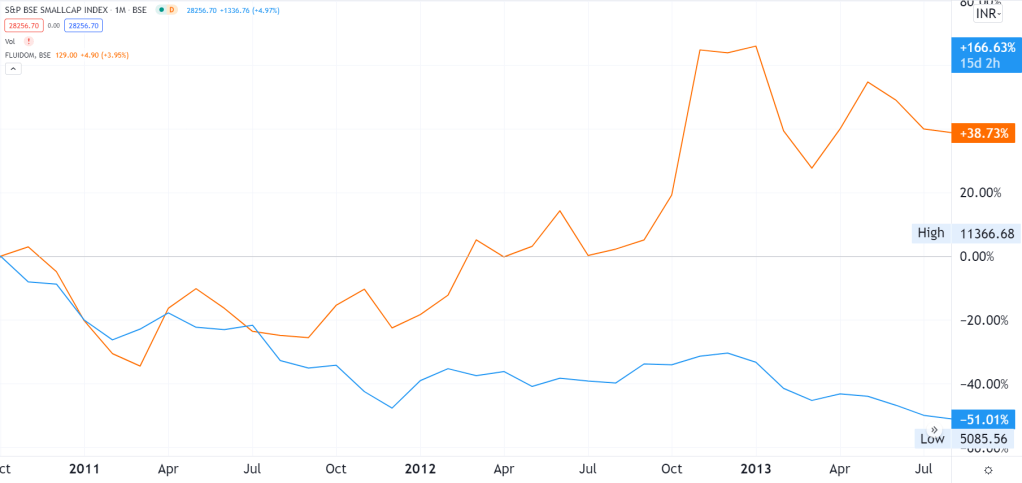
In FY2020, Alembic earned a return on equity of 26% after incurring high R&D expenses. While ROE can be used to measure a company’s efficiency, it is also my hunch (based on number crunching several fraud cases), that companies with 20%+ ROE in some industries are less likely to give us things to worry about vs the ones with lower ROEs. Barring exceptional cases, companies with ROEs above 20% and high cash flows are less likely to result in permanent loss of capital for minority shareholders. In most cases where there are corporate governance issues, you’ll either find low ROEs or low cash flows as compared to PAT. This is a shortcut that I use to filter companies quickly.

What are a few things that can kill this idea?

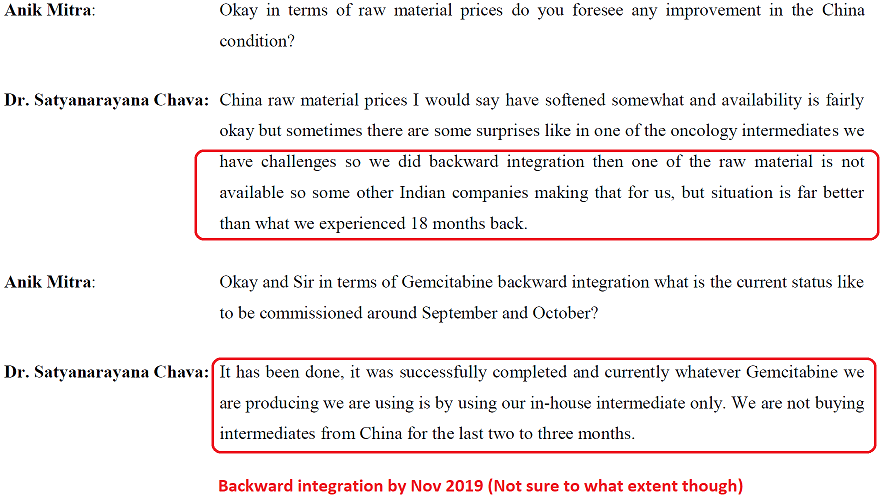
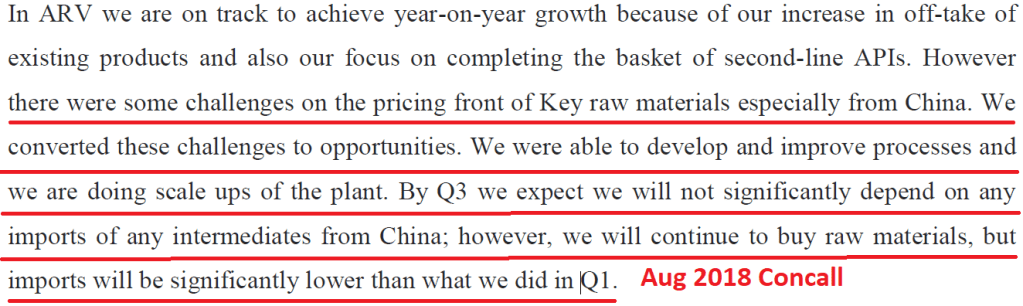
Exporter risk – Early in March 2020, the government of India, banned exports of APIs and some basic chemicals. If the situation changes, and exports are banned again, for reasons (unknown-unknowns) that we can’t anticipate, this would adversely impact the company.

Infection risk at plants – At least 2 other pharma companies have reported several of their employees got infected, recently, possibly at work.

Pricing power risk – The company may not end up being able to pass on the increase in API costs or other raw materials to it’s customers. We will need to wait and see how this plays out over the next few quarters. This risk also applies to their generics business. Other generics players producing the same drugs may result in margin erosion for the company.

For example, data from an article from the US FDA site states, higher the number of generic players, lower the drug prices.

So if the branded drug sells at ₹100 and there is just 1 generics player, then the generic drug would sell at ₹61. However, if there are 6 Generics players, then the generic drug gets sold at an abysmal 5 bucks.

Other risks include Macro risks due to uncertainty around Covid19, Opportunity cost risk, Logistics / Raw material risks & Dilution / Leverage risk (The company has been growing faster than the ROE it delivers)

Valuation

Why investors are likely to pay top dollar for pharma companies in the near future?

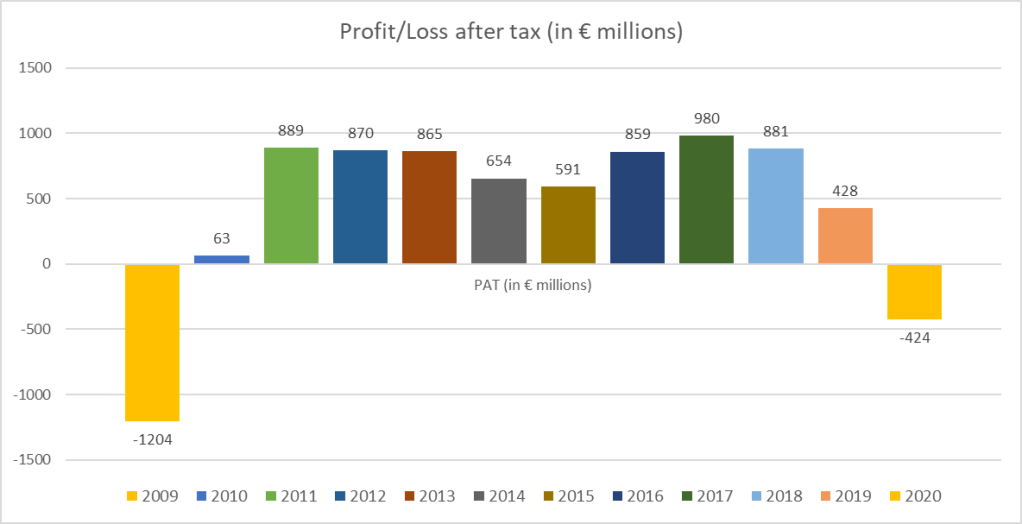
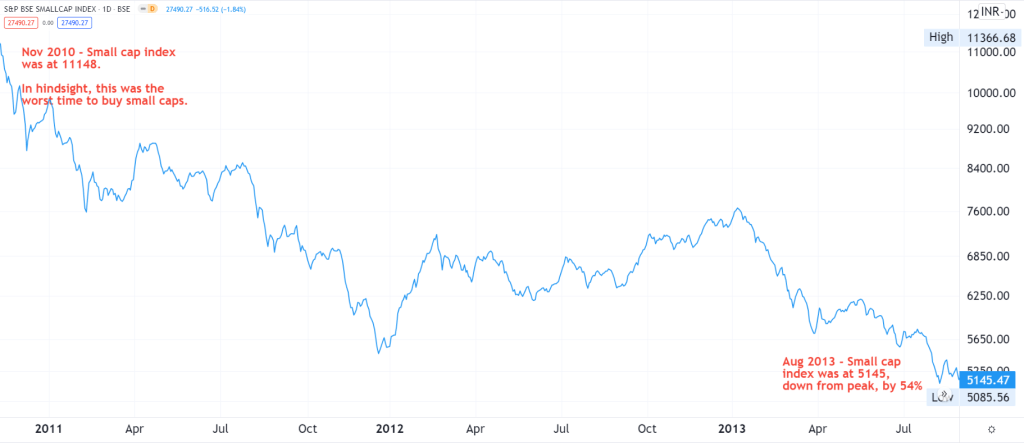
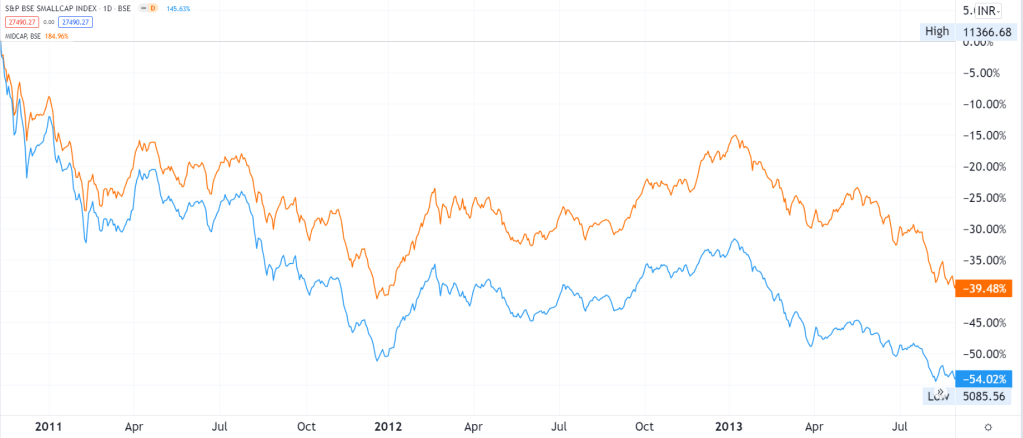
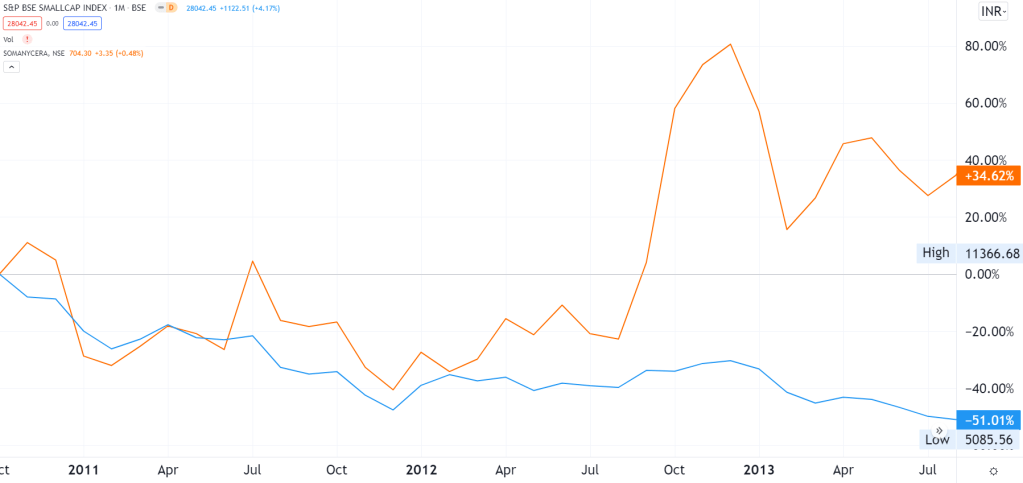
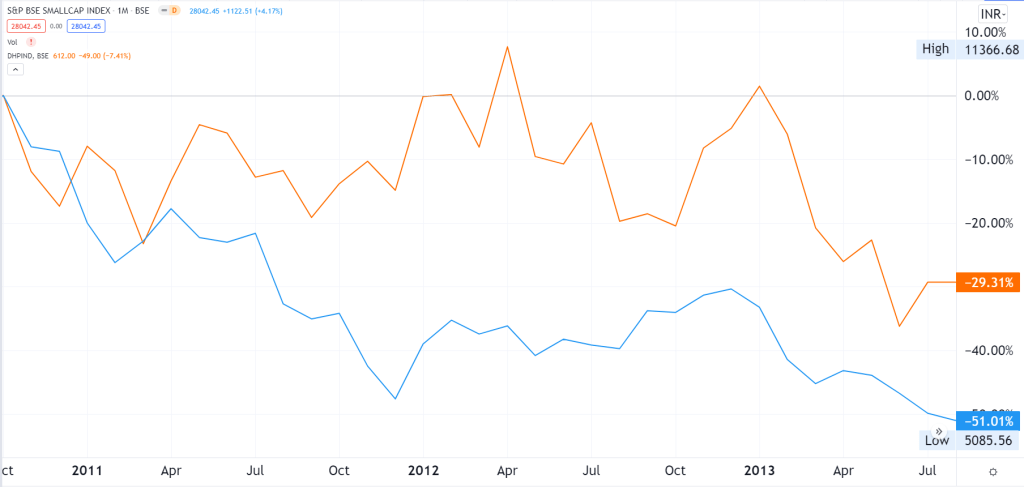
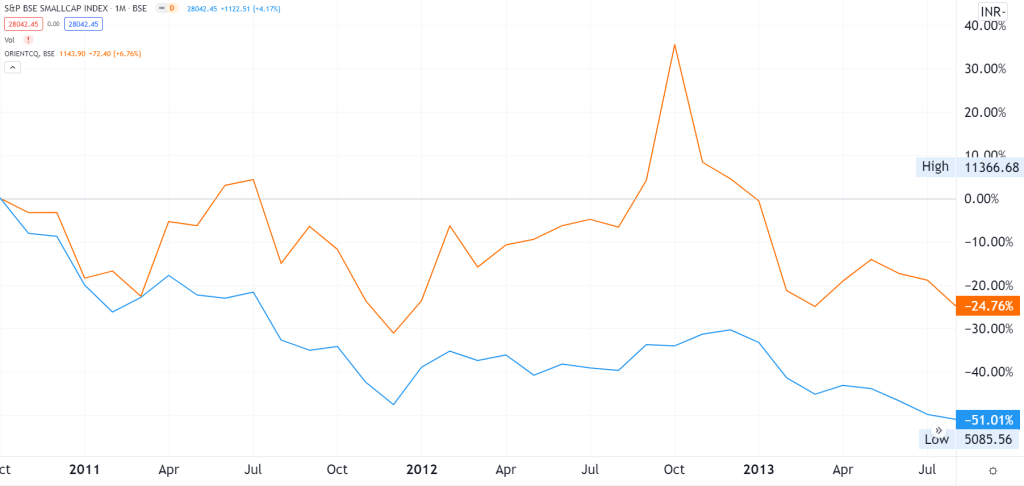
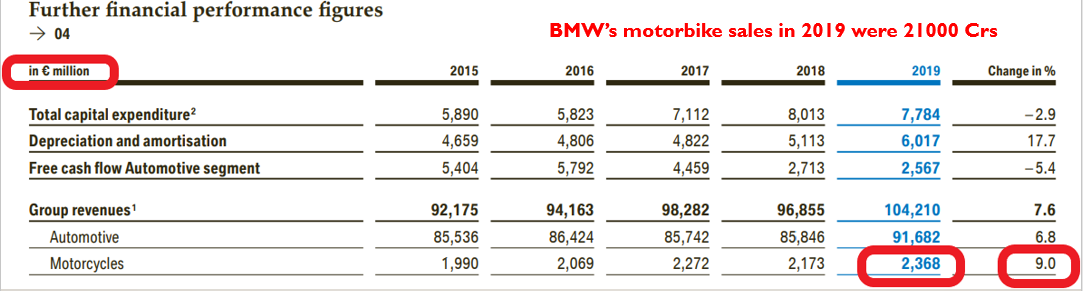
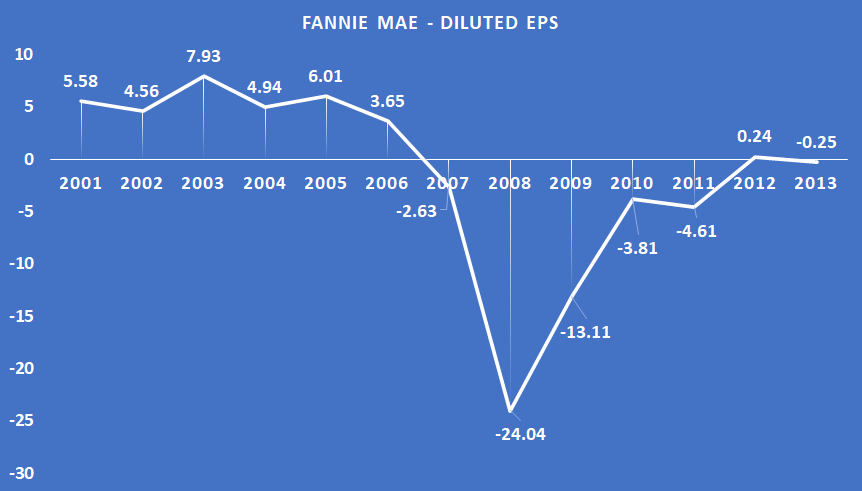
  • The markets hate uncertainty and given the current uncertainty around earnings prospects of most companies, one sector that is recession proof is Pharma. This is because, no matter how the Covid situation impacts the economy or no matter how long it takes scientists to develop a vaccine, patients are not going to reduce consuming medicines. For example, I looked up sales numbers for pharma companies between 2008 & 2010 and a majority of pharma companies’ sales went up, although every other sector was hit by a recession. I believe it is reasonable to assume that pharma companies (and other sectors with good earnings visibility) will see better valuations in the near future, compared to sectors which have low or no earnings visibility, such as Oil, NBFCs, Real Estate or Auto, etc. Moreover, if lockdowns are extended or reintroduced, Pharma companies are less likely to have a production impact since they serve an essential human need which cannot be deferred to a future date. Unlike most other industries, there is no concept of pent up demand in the essential drugs business and patients cannot postpone consuming drugs to a later date.
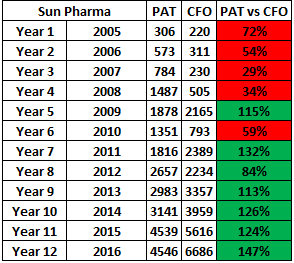
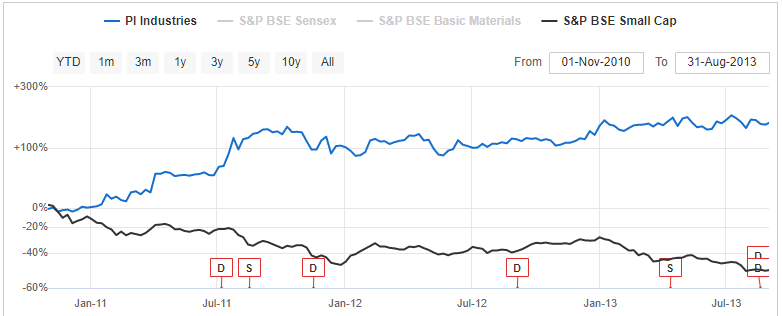
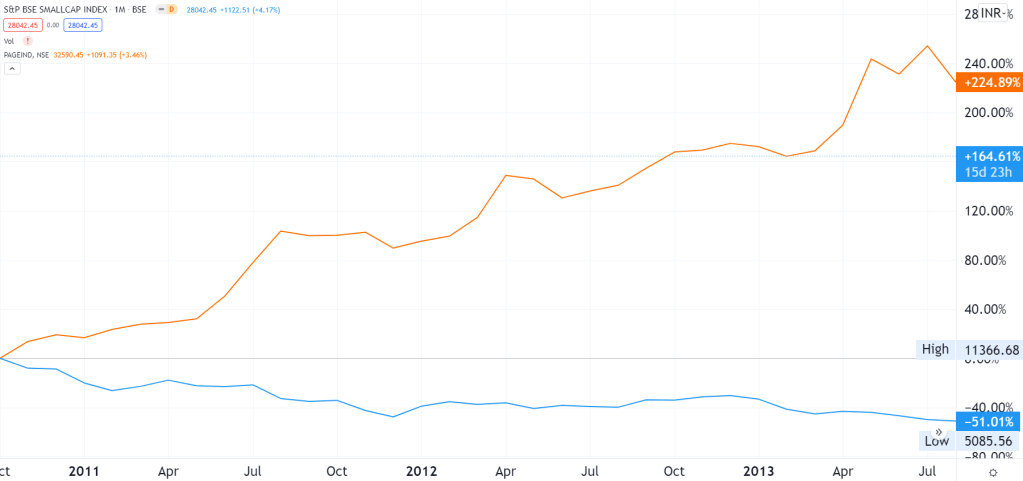
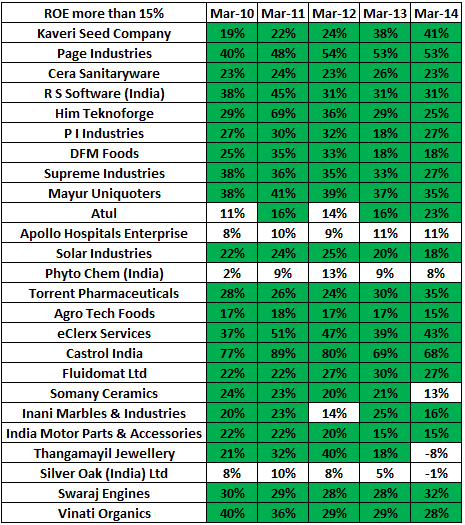
  • Scarcity of high growth companies in the current environment is likely to drive up valuations for the ones that promise growth in tough times. Some investors may perceive 17-18 PE as expensive but I disagree with that notion, and believe we should buy growth and not PE. For example, in 2009, Page Industries’ stock was selling at 17-18 PE at some point and some people considered it expensive and fell into the statistical cheapness trap. They ignored the fact that Page had grown revenues at 45% CAGR between 1996 & 2009 and PAT had grown at 68% CAGR between 2005 & 2009. We all know the outstanding returns it subsequently delivered for the ones who looked at growth instead of PE.
  • In his wonderful blog on VST industries, Prof. Bakshi mentioned this

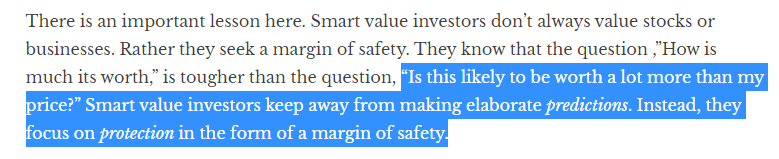
I believe, at my buying price, this would apply to Alembic too. At 17-18x TTM reported earnings, for a company with high R&D exp and one that’s rapidly growing, the downside looks limited, whereas there is option value embedded in the stock in the form of an upside from the Azithromycin opportunity as well as the other approvals that the company hasn’t monetized yet. In other words, I may be wrong on how much upside there is from the Azithromycin situation, but I don’t think I have paid too much for the growth I anticipate from it. My average buying price is a little less than 700 bucks, which is marginally higher than, what the market was pricing this company’s stock before the Azithromycin opportunity knocked the company’s doors.

If the Azithromycin situation plays out as I expect, then it’ll result in a significant growth in earnings for the company.

If it doesn’t play out, then there is a high chance the company might still continue to grow well, as it has demonstrated over the last few years.

  • Besides, economic earnings are higher than reported earnings because the company spends a fortune on R&D. A high R&D expense shows that the management is willing to forego immediate benefits, in order to ensure future growth and has the deferred gratification gene. The management team mentioned they are looking at 700+ Crores R&D Exp in FY2021, on their latest concall & this increased R&D Exp is in a year where most other sectors are announcing layoffs, cost cutting measures, etc.

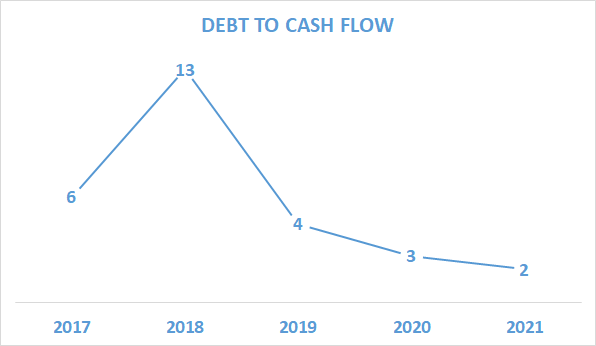
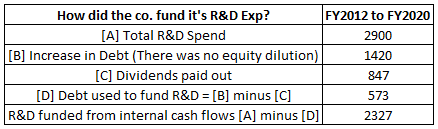
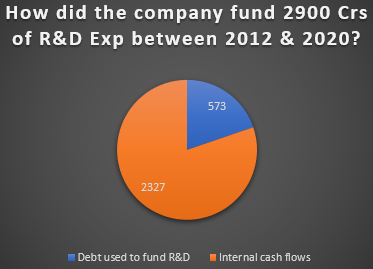
How did the company fund it’s massive R&D program?

The company spent a total of 2900 Crs on R&D between 2012 & 2020.
In the same period, their debt increased by 1420 Crs.
Out of this 1420 Crs, 847 Crs were paid out to shareholders as Dividends.
So these guys went to the bank, borrowed 1420 Crs from the bank and out of this 1420 Cr loan that they took, they passed on 850 Crs to Shareholders as dividends.
So that left them with 573 Crs which they could now use to fund some portion of their R&D.
So, this means the company funded 2300 Crs or 80% of it’s R&D exp from cash flows that the business generated and 573 Crs or JUST 20% of R&D from debt.
Was it funded by diluting equity? No, because no new shares were issued.
So that leaves us with the only other source of funding which is Cash Flow from Operations.
So 80% of their R&D exp was generated by cash that the business generated.

The co. funded 80% of R&D Exp from internal cash flows and 20% from debt

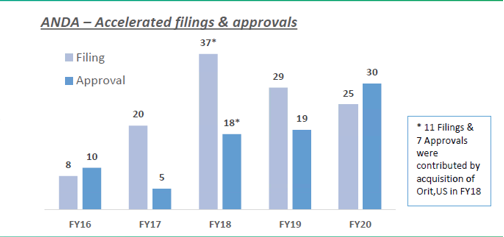
The outcome of all this R&D expenditure can be seen in the new approvals that the company receives from the US FDA.

Some folks I spoke to, raised concerns about high R&D expenses (investments?) by the company. Lets think about what happens when, a company has a lot of approvals.

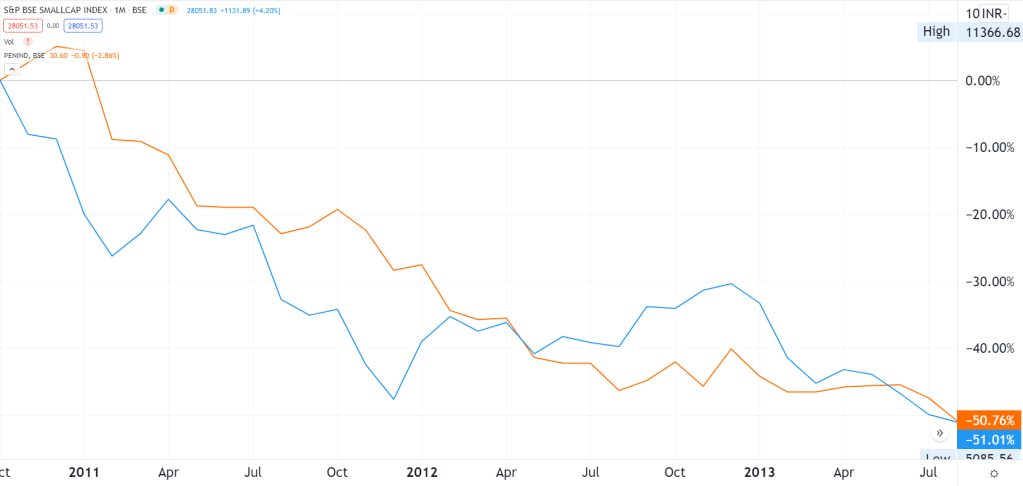
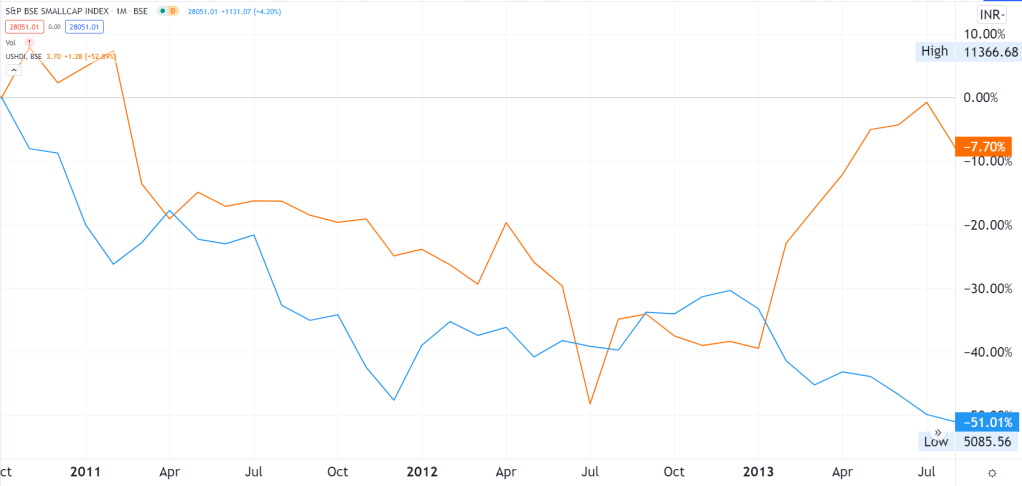
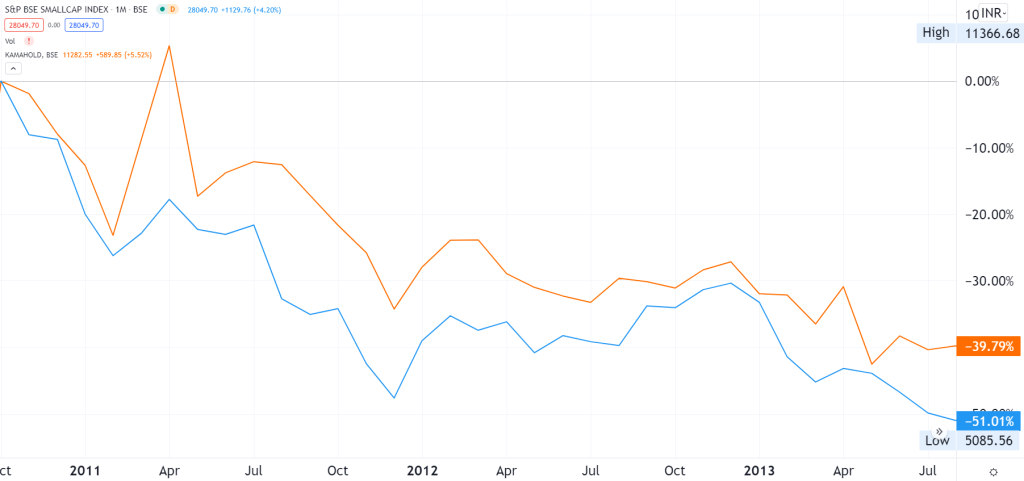
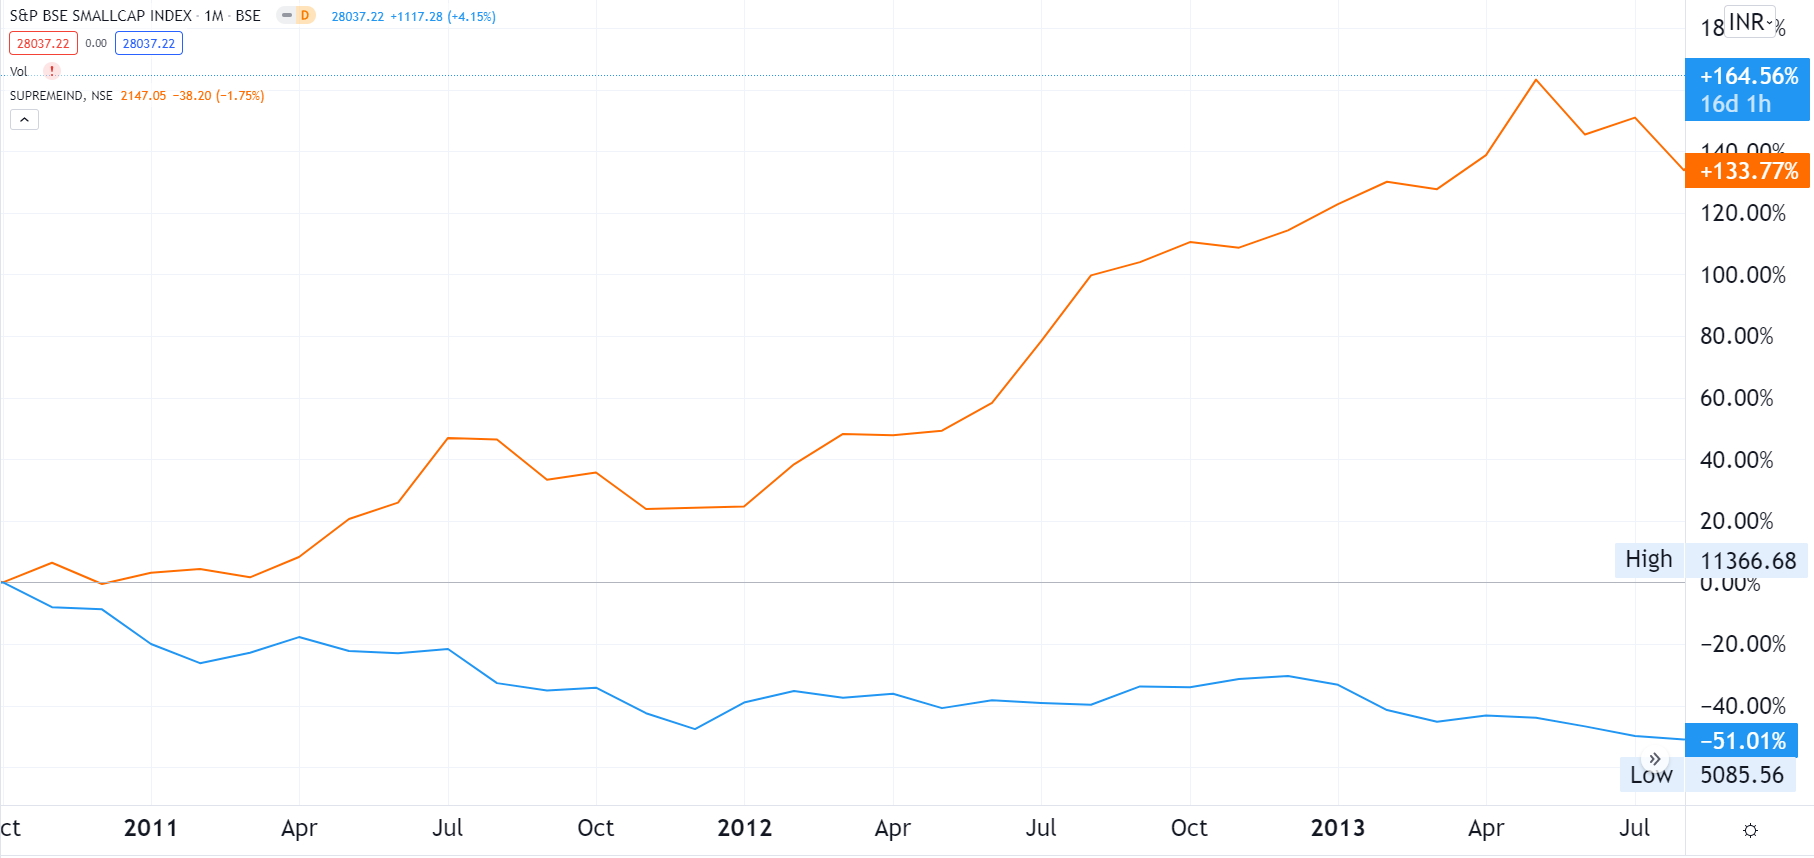
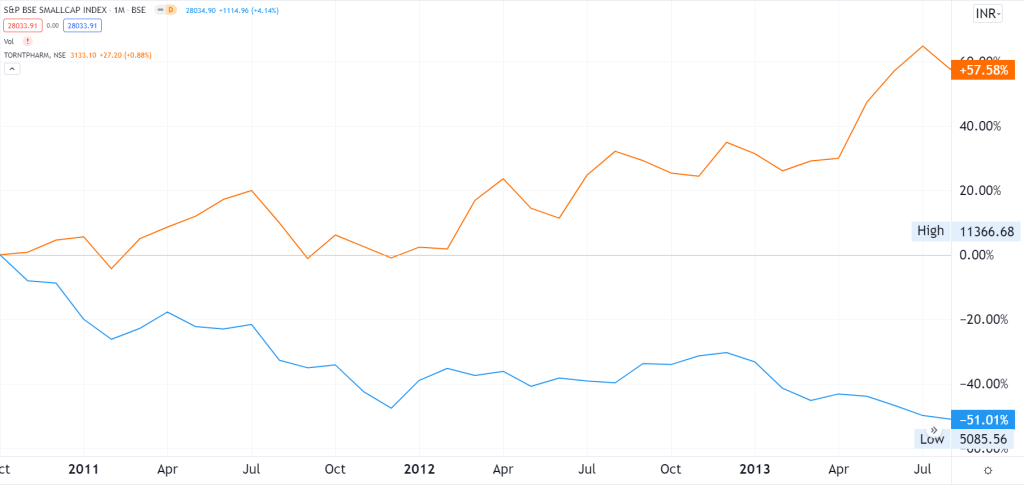
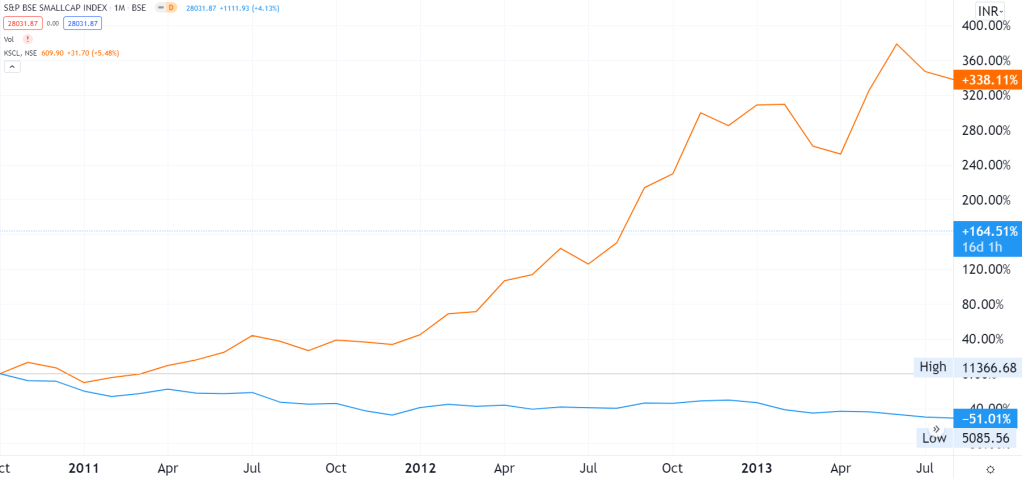
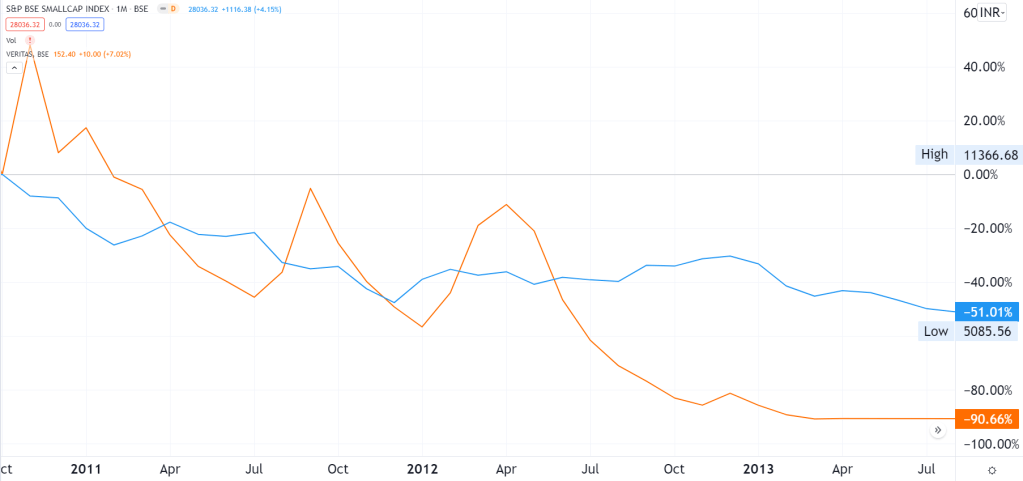
By securing more approvals with potentially huge payoffs, the company gets more exposed to positive black swans. A case in point would be Alembic’s opportunistic plays at 3 different times. Alembic,

  • benefited from the opportunity in Abilify drug back in 2016 or thereabouts
  • is benefiting from the ongoing opportunity in Sartans drugs in 2018 (expected to last until Dec 2020 or beyond)
  • has the potential to benefit from the ongoing opportunity in Azithromycin in 2020

Was it a case that company got lucky thrice or was it because the company had so many approved products / approvals in place, which ensured they were (almost) exclusive sellers of 3 products that were in solid demand? Were they thinking “Heads I win big, tails I don’t lose much”?

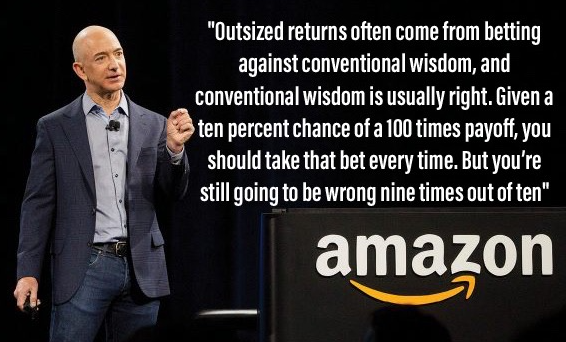
In my view, Alembic seems to be taking the approach outlined by Jeff Bezos – Given a 10% chance of a 100 times payoff, you should take that bet every time.

Here’s what somebody somebody wrote about ANDA filings elsewhere. And this is one hell of a way, to think about the big number of ANDA filings this company has, in comparison to other companies of similar sizes.

I personally think of filing ANDAs as Making Dices which the pharma company gets to roll once. If you roll and you get “6”, you get a windfall. If you roll the dice and get “4” or “5”, you get a reasonable amount. If you roll the dice and get “1” or “2” or “3”, you get nothing. The more dices you manufacture, the more number of times which you can possibly roll. There is a role of luck, but for that to happen you have to have a dice in your hand. And possibly as many dices as you can. Abilify was one of the dices which alembic rolled and luckily got a “6”. With the money from this, Alembic is now manufacturing many more dices . We don’t know which dice in future would be a jackpot, but what we know is that Alembic is surely producing many more dices to roll in future.

From the book – 100 to 1 in the Stock Market by Thomas Phelps

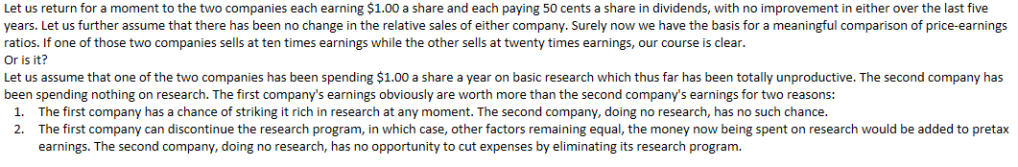
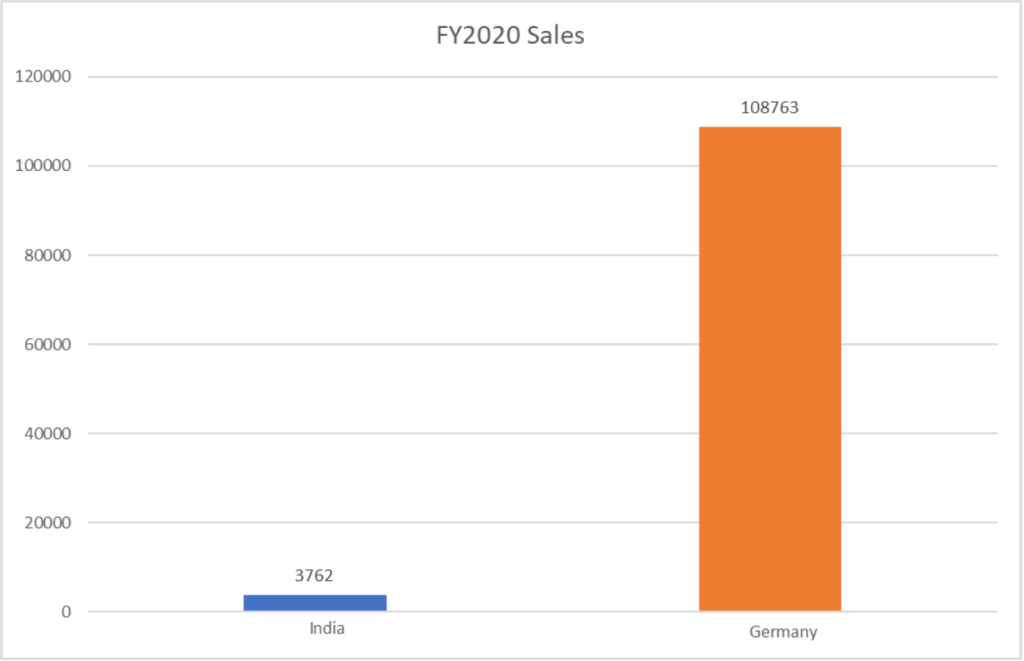
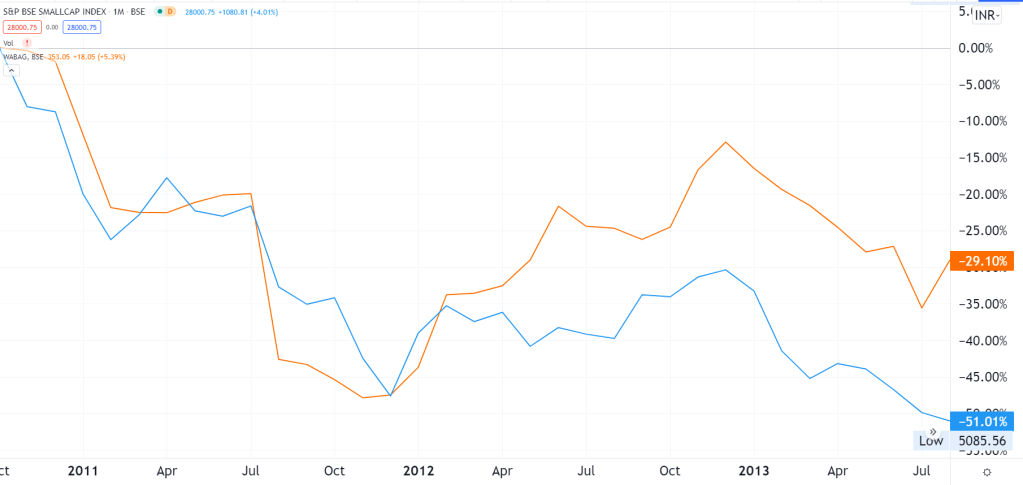
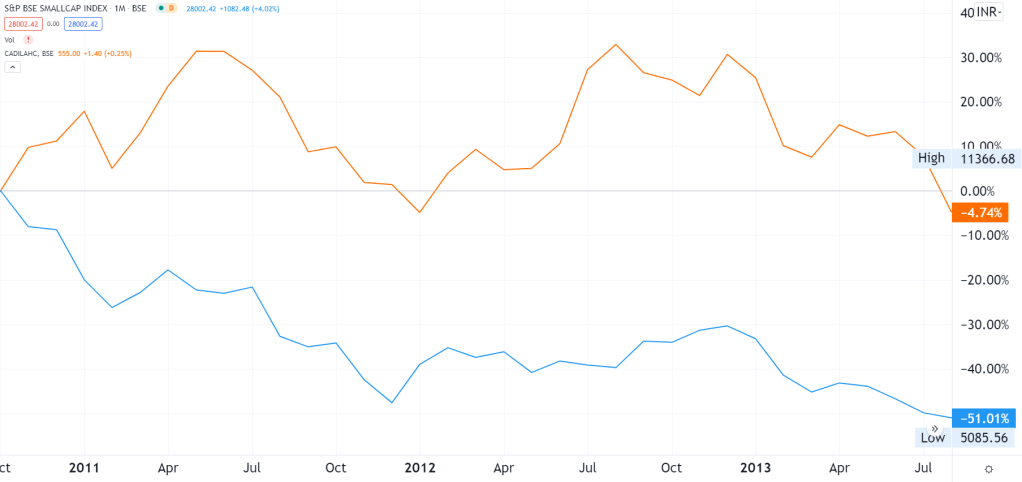
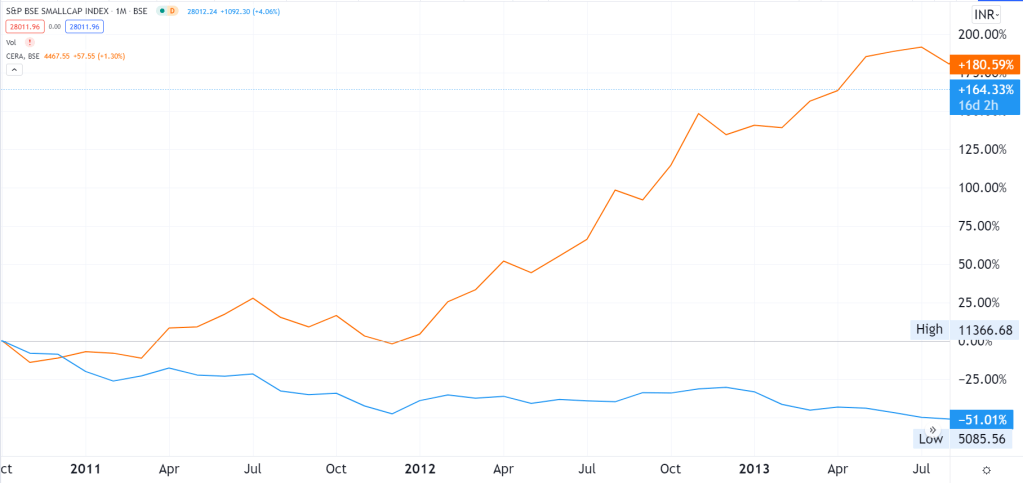
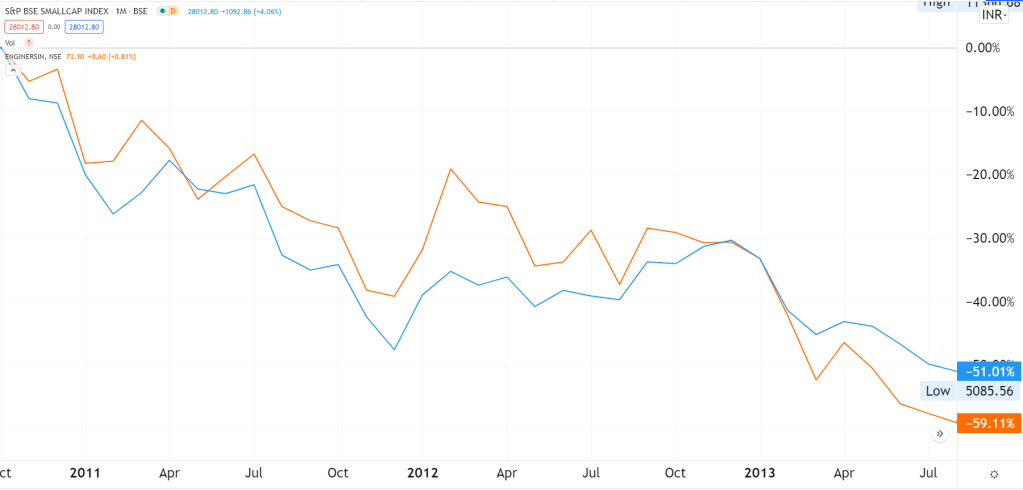
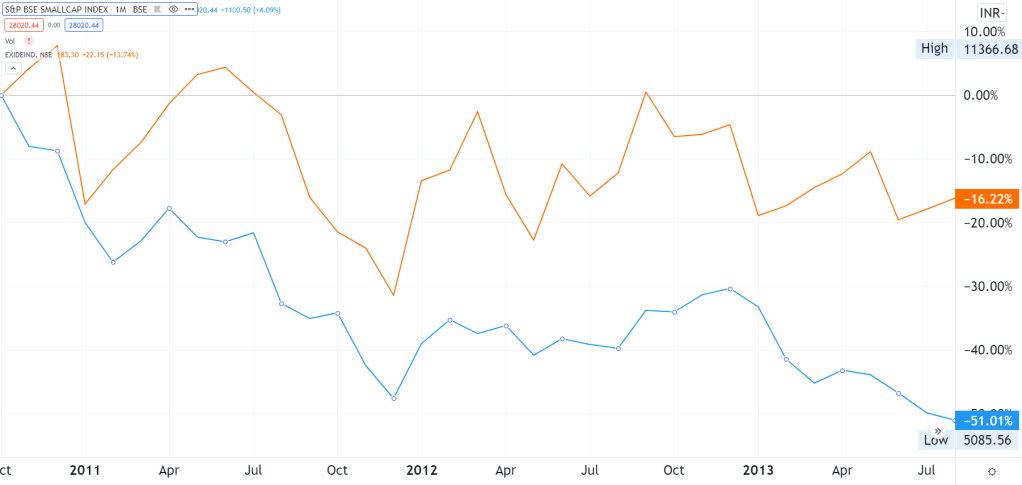
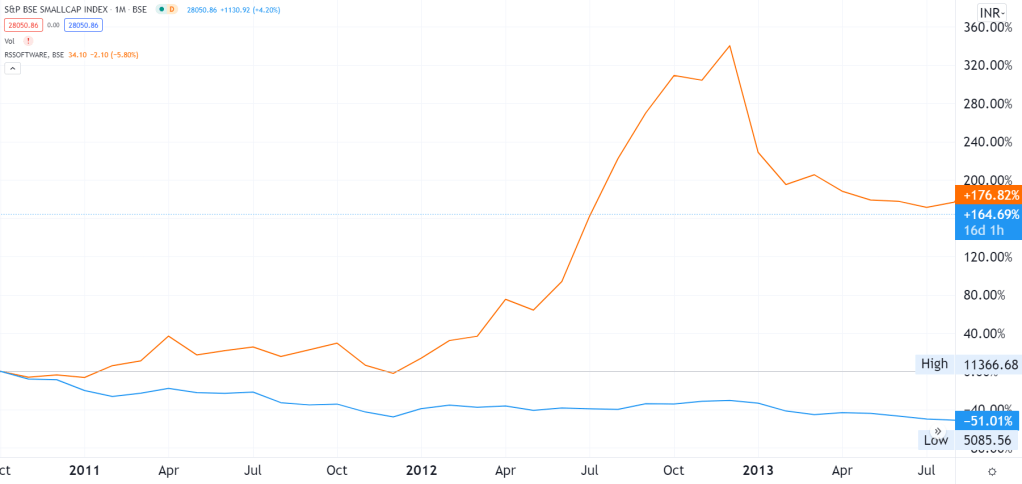
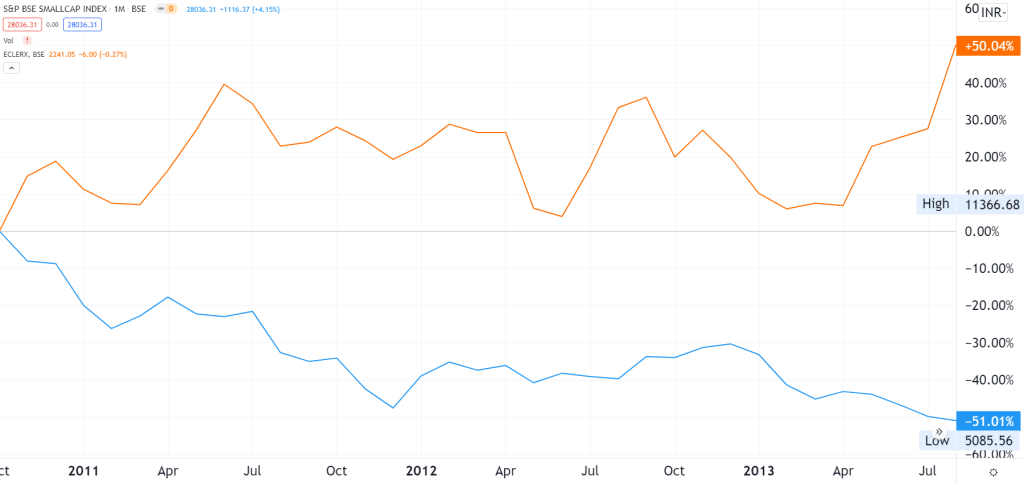
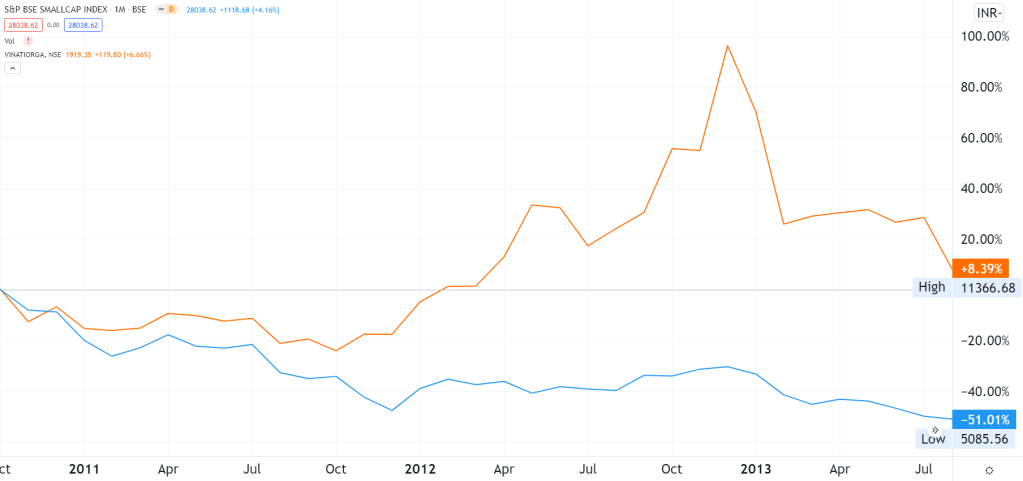
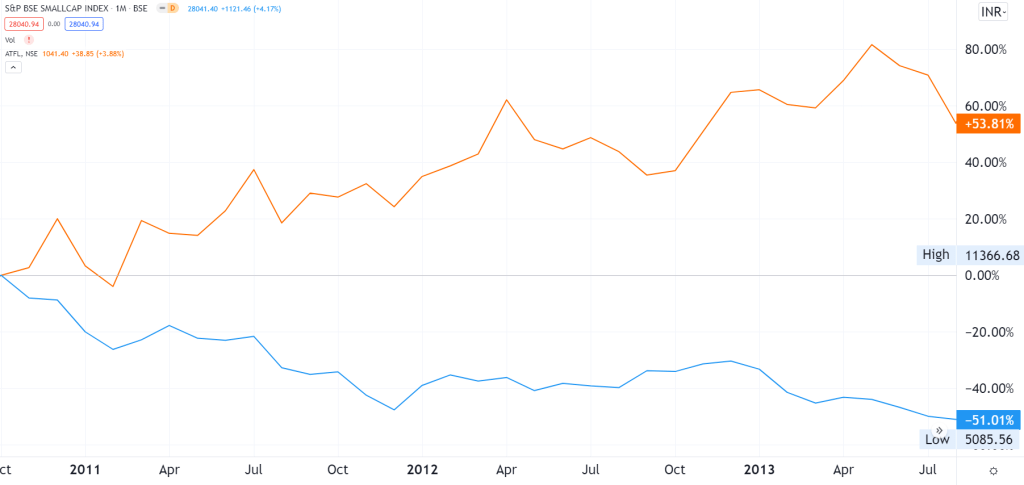
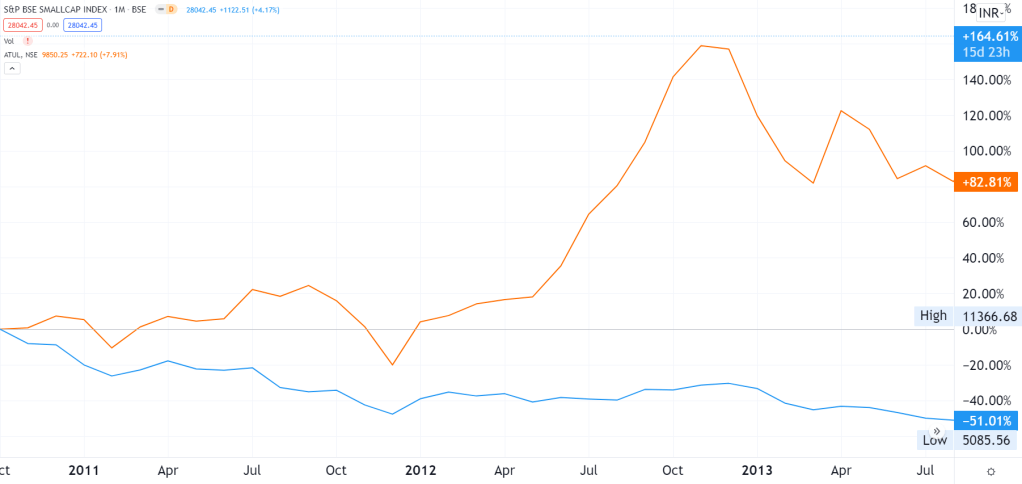
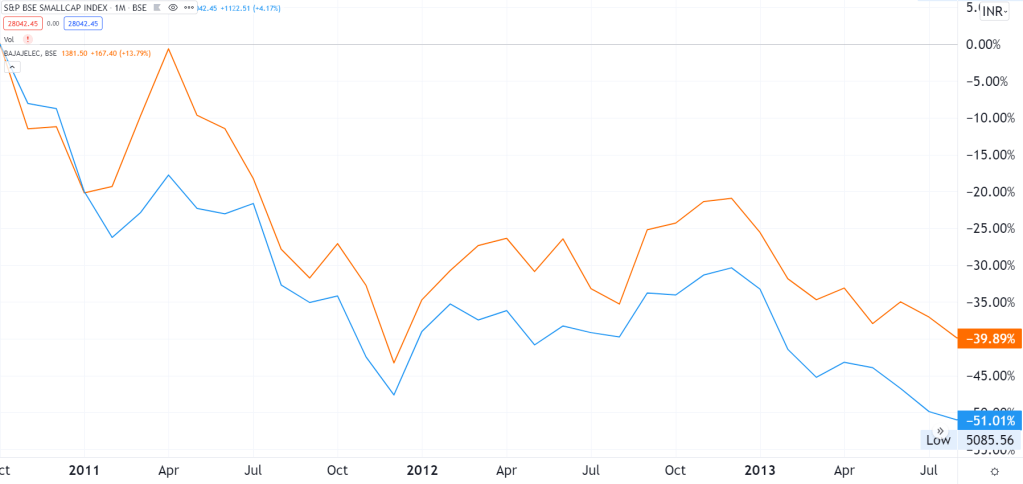
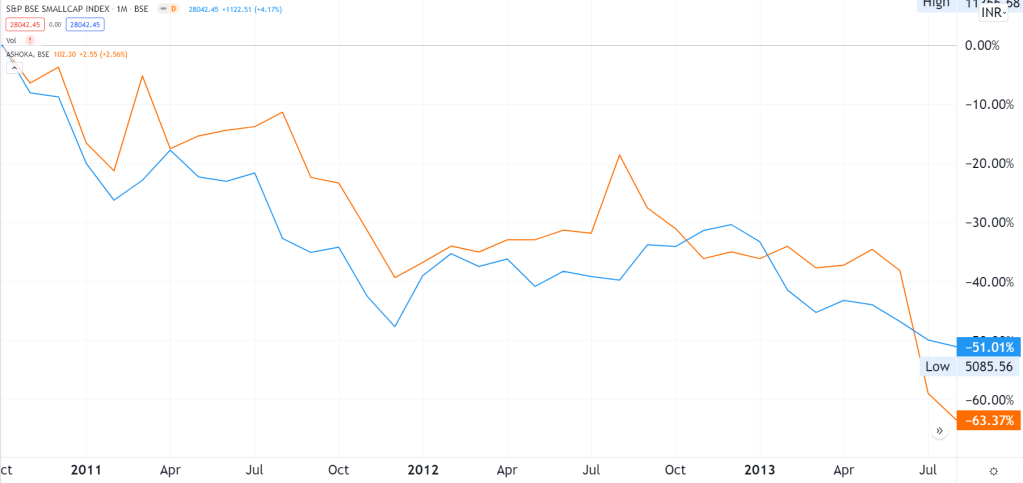
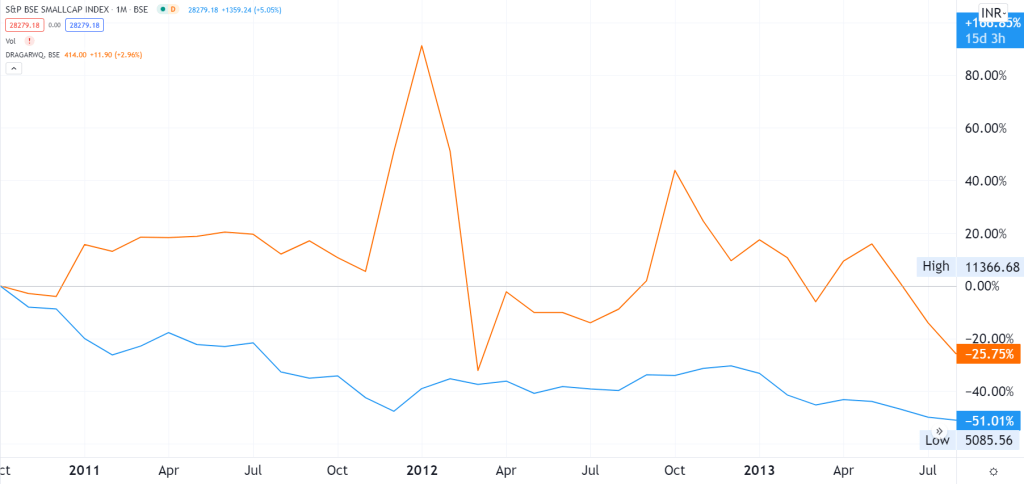
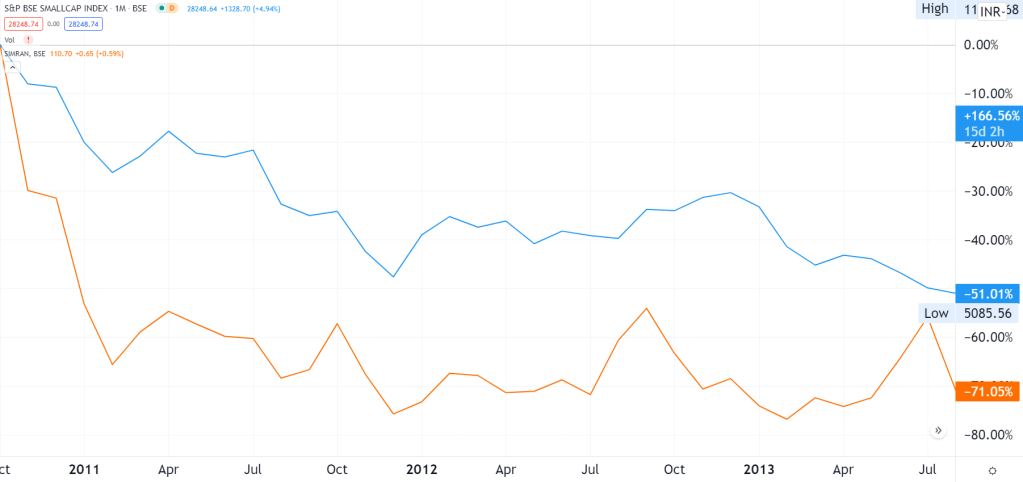
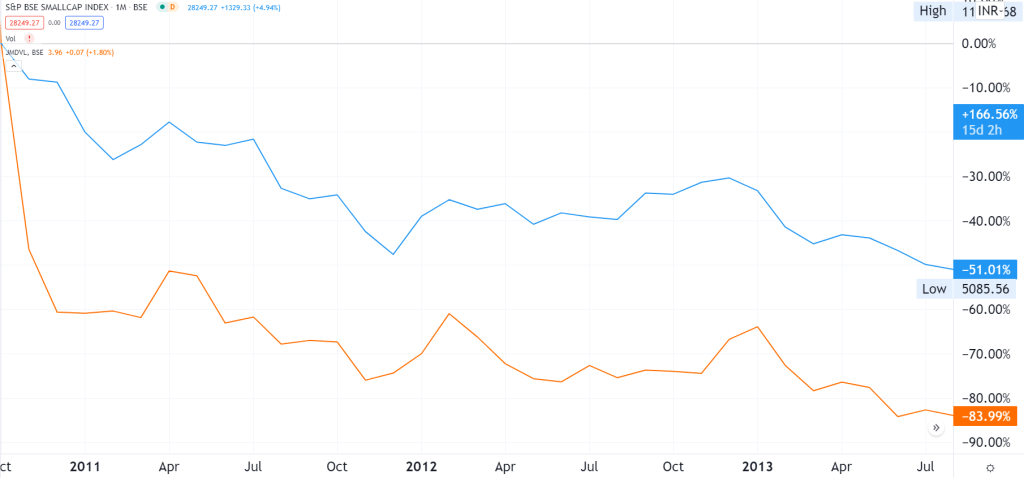
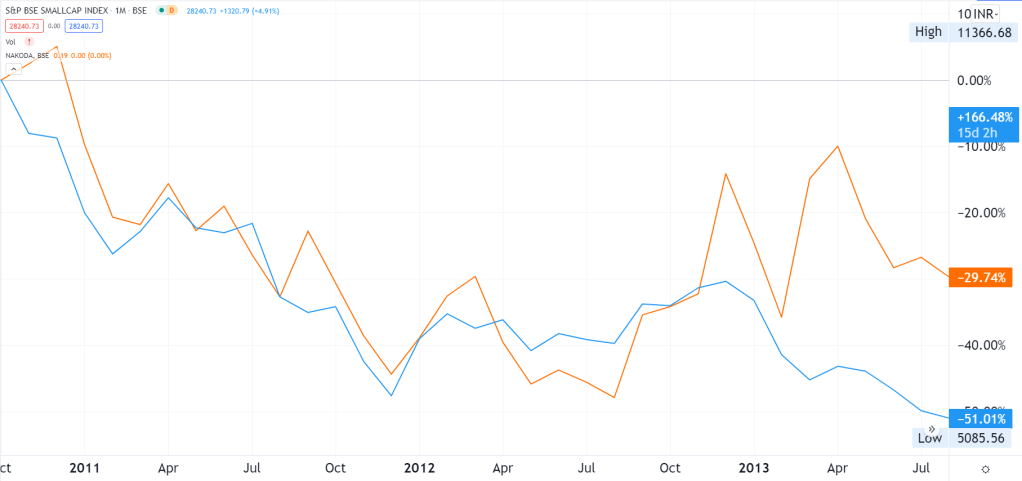
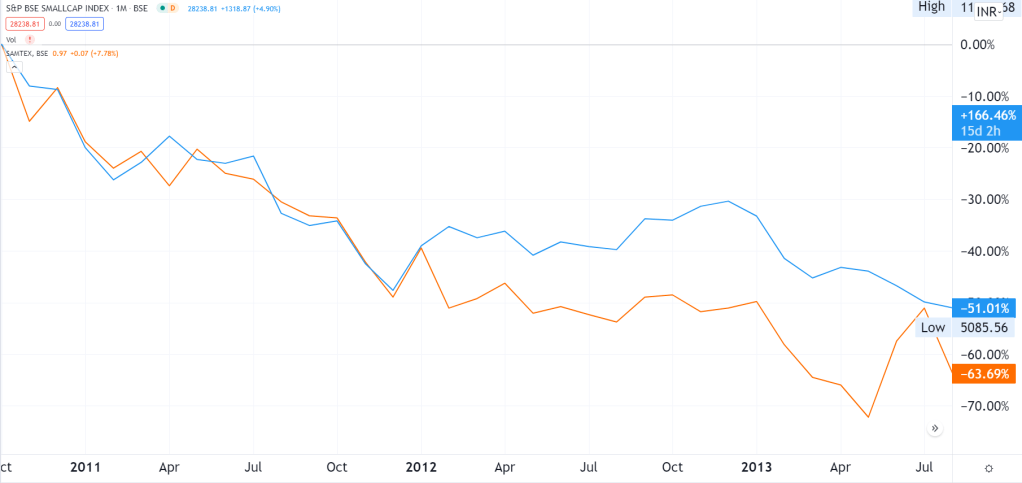
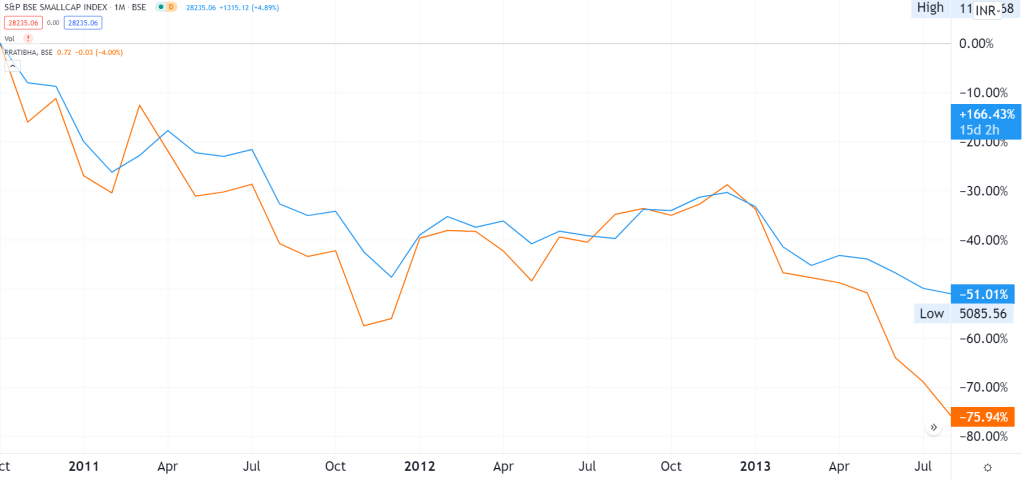
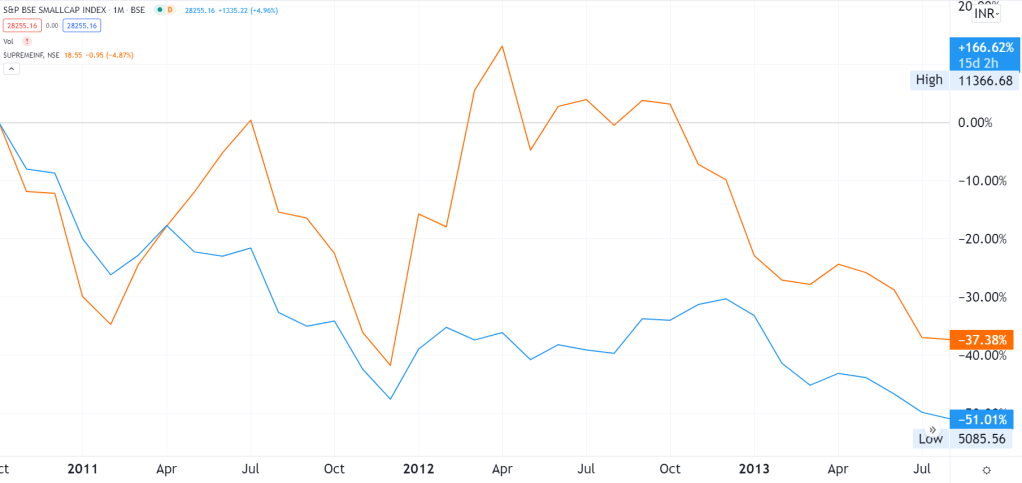
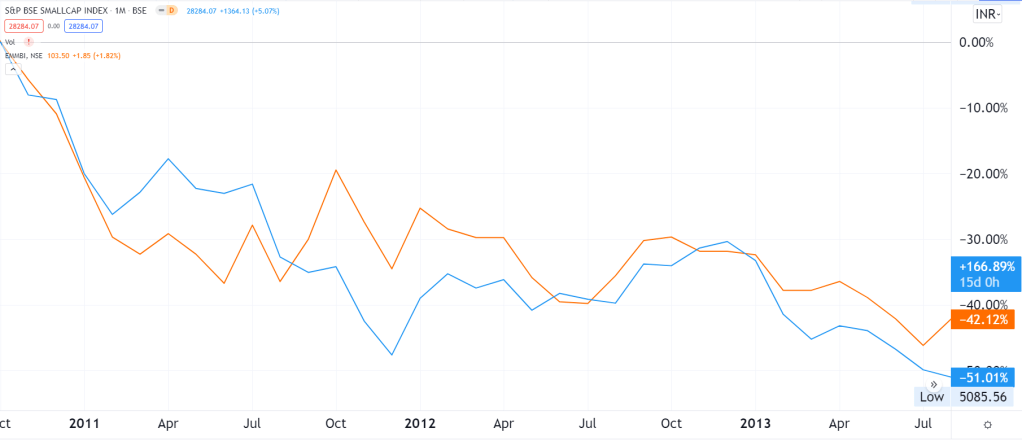
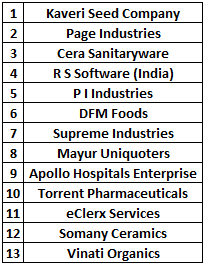
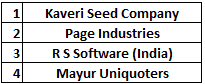
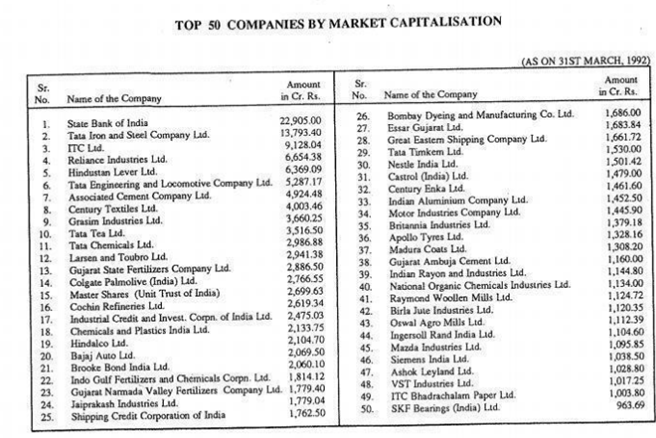
Imagine Nifty was a single company. Which of the following companies is likely to have better prospects?

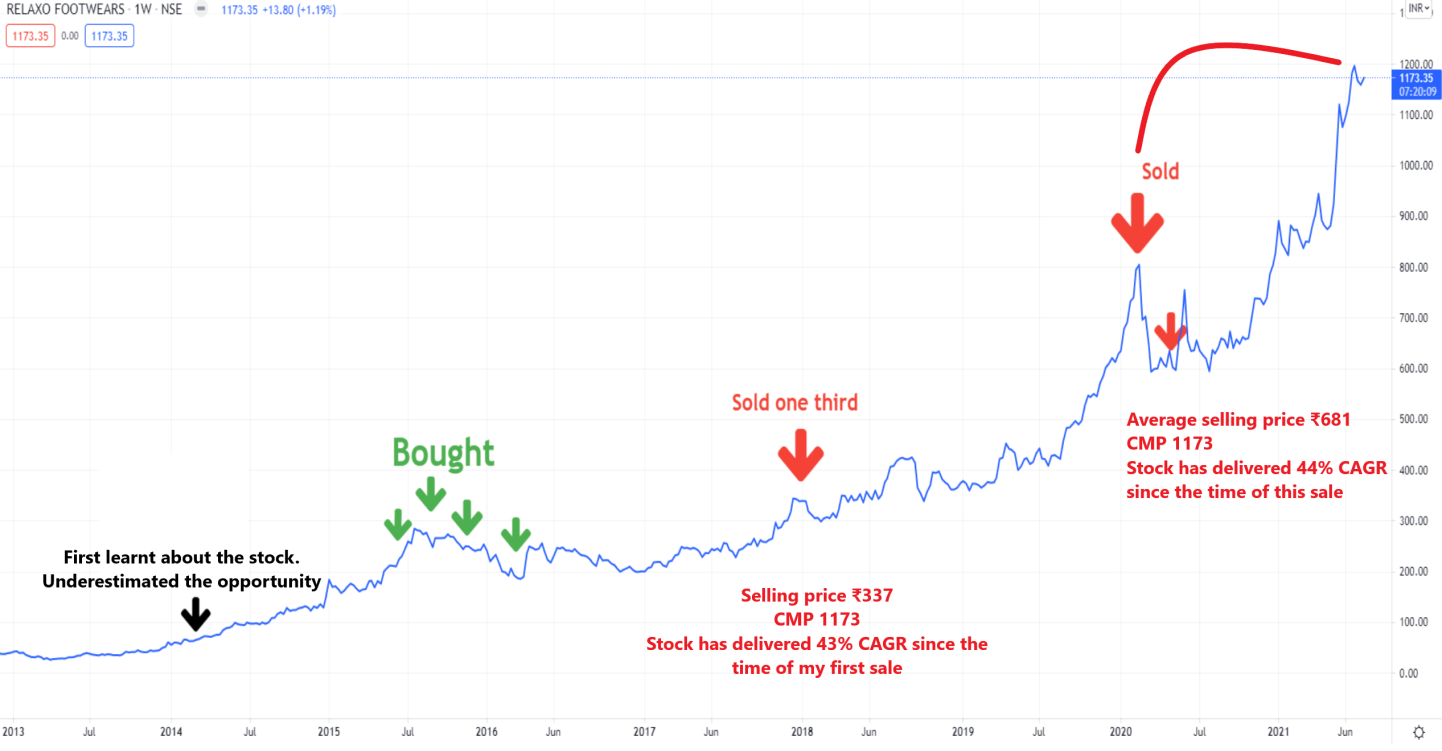
Here’s a good way to think about High R&D expenses. From Prof. Bakshi’s Relaxo lecture.

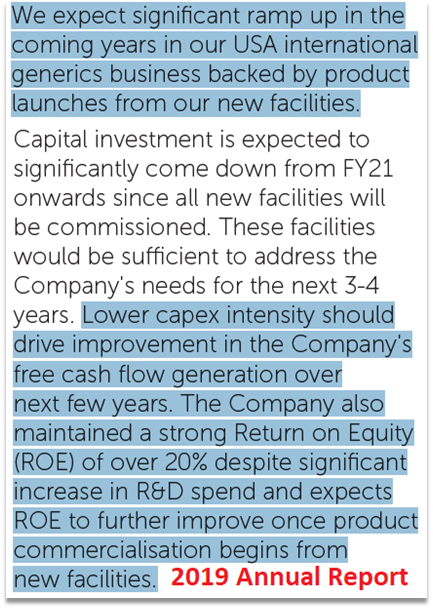
As stated earlier, Alembic earned a return on equity of 26% after incurring high R&D expenses in FY20. And here are the managements’ thoughts on R&D exp, ROE and Free Cash Flows in the next few years.

Addendum – Writing about some questions I was seeking answers to – 26th May, 2020

Why are margins high?

The company’s FY19 annual report states – “A good supply chain helps protect margins and also provides us with some room to improve our pricing.” I believe the reasons for higher margins could be the company’s supply chain + their US front-end marketing team + some pricing power due to the Sartans issue.

With this I conclude my investment thesis on the company.

Disclosure – I and my clients have substantial positions in this company and my views are certainly biased. This blog is not to be construed as an investment advice. Please consult your investment advisor before investing.

Disclaimer: This is NOT investment buy/sell/hold advise. I am not SEBI registered. May change stance on above business anytime with new developments and/or new insights, and/or overall market conditions. May NOT be able to update periodically. Please do your own diligence and/or take professional advise, before investing.

-Barath Mukhi

13th May 2020

Why Elon Musk thinks Lithium Ion batteries are the new oil, how Gujarat Fluorochemicals will benefit & why you should be interested?

And when these new businesses come in, there are huge advantages for the early birds. And when you’re an early bird, there’s a model that I call “surfing” – when a surfer gets up and catches the wave and just stays there, he can go a long, long time. But if he gets off the wave, he becomes mired in shallows. But people get long runs when they’re right on the edge of the wave, whether it’s Microsoft or Intel or all kinds of people.

Charlie Munger

Today I am gonna be writing about a specialty chemicals company that has shown a compounded growth rate of 60% in one of it’s verticals. The growth of this vertical is being driven by demand from lithium ion batteries, which are critical to the continuation of this EV wave.

We’ll take Tesla’s sales, currently the biggest and the most undisputed successful electric vehicle company in the world, as a proxy for what’s happening in the EV industry. Here’s how they’ve grown over the last decade plus.

The electric vehicle wave is here to stay. Here’s a chart that shows the kind of explosive growth EVs have been seeing, worldwide. And we are just getting started in EVs. EVs were just 8% of total cars sold in 2021. Can this number become 50% over the next decade? Nobody knows!!

Demand for EVs in turn is leading to demand for Lithium Ion batteries.

“What about the next 10 years? I’ll be surprised if it’s not over 100 million in 10 years.”

Elon Musk about the future volumes of Tesla – Aug 2022

In 2022, Tesla is likely to produce 2 million cars. And Musk thinks they’ll be able to produce 50x that number of cars in 10 years.

50x in the next 10 yrs!! To grow 50x in 10 yrs, Tesla will need to grow at 50% per annum, every year for the next decade. To put things into perspective, the total number of cars (ICEs + EVs) registered in the US in 2021 was 290 million (This includes old as well as new cars). And the EV market leader there, is selling a miniscule 2 million cars this year. Wow!!

And here’s what he recently said about Lithium batteries!!

The Indian business we are interested in, is Gujarat Fluorochemicals, a 37 thousand Crs Market Cap co. that I expect, could surf the EV wave neatly, over the next few years, or at least it looks so, at the moment. So GFL makes stuff that goes into Lithium Ion batteries.

Let me start with a notice that GFL gave to it’s customers in April 2021.

Basically they were saying:

  • There was high demand for PVDF & FKM and will continue to remain so.
  • R142b was in acute shortage, globally!!

What exactly are FKM, PVDF & R142b? What does this stuff have to do with the EV wave? I’ll come to that in a minute.

First, here’s an overview of GFL’s backward integration, which it has painfully developed over many many years.

Let me start with a story.

So back in 1987, countries basically came together and decided to gradually phase out CFCs that were killing the ozone layer. R22, which GFL also makes, is one of the gases that was phased out. R22 can still be made by cos and used as a raw material for other stuff.

If a competitor needs to make PVDF and FKM, they’ll need R22, R142b (which again is in high demand worldwide, without enough supplies).

So what is PVDF? And where does it fit in the EV battery chain?

PVDF is a fluoropolymer that is used in stuff that requires the highest purity, as well as resistance to solvents, acids and hydrocarbons. Below is an image which describes the stuff that goes into batteries.

Source – Arkema, another PVDF maker from France

More on PVDF Binders and Coatings from Solvay, another global player that is into fluoropolymers.

Moving on to FKM. What exactly is it?

Why is FKM, another fluoropolymer, in demand? And what kind of market share does GFL have in this product? The answers are in their July 2022 concall.

And they will have at least 10% worldwide market share in FKM.

Okay so what’s the big deal in having a 10% market share? Can’t another set of players just come in and make more FKM and other stuff that GFL makes?

Dated Feb 2022 – Got this from Google so can’t really verify the authenticity here.

Here’s one more from another site, which says building chemical plants will take longer than building semiconductor plants. Semiconductors are another industry where FKM is used. This comes from an executive from Daikin which is a major fluoropolymer manufacturer.

What stops a potential new entrant from coming in with new capacities here?

Besides, GFL started out as a commodity Fluoropolymer player and over a course of time created a large no. of Fluoropolymer grades specific to their customer. This leads to a lot of customer stickiness and makes life difficult for a potential new entrant.

One of the raw materials that is not available for producing FKM, PVDF and other fluoropolymers is R142b, a refrigerant gas that not many cos on the planet are allowed to manufacture. New approvals for these gases take a long long time because of the ozone depleting potential of these gases.

And here’s a co. that will not only use R142b for captive consumption but also export it. Talk about having your cake and eating it too.

Essentially these facts mean fluoropolymer cos worldwide are:

  • In huge demand, thanks to rising consumption of Lithium Ion batteries.
  • There are not enough capacities that can meet this demand.
  • Players that make both, the raw materials as well as the end product, are at a huge advantage, compared to the others.
  • It takes many years, lot of effort, approvals and expertise to add capacities.

This puts players like GFL in a sweet spot. Btw GFL is the only company in India to make and export some of the products I have written about and other spec chem players in India are likely to take a while before they can catch up.

One of the things I’ve learnt as an investor is that we should view businesses as stories that are unfolding and not as pictures of still water. A lot of these growing businesses spring up happy surprises when you least expect them to. I am sure very few investors or perhaps nobody, a few years ago, would have imagined PVDF would become such a big business for GFL.

Yet, here’s how the movie unfolded. Starting with PTFE suspension, they gradually moved to PTFE Emulsion, FKM, PFA, FEP, Additives and eventually to PVDF.

Source – 2020 Annual Report

And here’s how the management is expecting their Specialty Chemicals business to play out. Specialty Chemicals which is a 300 Crs business in June 2022 could potentially transform into a 2000+ Crs business over the next few years, thanks to battery chemicals such as LiPF6 that they are planning to make in the near future.

Here’s a Chinese player, Guangzhou Tinci Materials, which makes LiPF6 and below we can see the kind of supernormal growth they are seeing in their business.

Source – Investing.com

And Tinci’s business in no mood to slow down. Here’s a recent news article which shows the kind of exponential growth they are seeing. The article also states they are expanding capacities.

Source – Tinci Materials Investors’ page

The fact that the lithium ion battery market is growing at more than 20% was also confirmed by GFL’s management in their May 2022 concall.

The future will tell whether or not GFL can execute their LiPF6 business the way they have done for PVDF & FKM. If LiPF6 works out well, that’ll be an icing on the cake.

New Fluoropolymers, which consist of PVDF & FKM are just 18% of their TTM sales. I foresee this division becoming a larger chunk of the overall pie in the near to medium term. Specialty Chemicals which would consist of LiPF6 in the future, is 7% of TTM sales and that could become a big one as well.

Risks

  • Corporate guarantees worth 1000 Crs+ given to Inox Wind – Inox Wind is another entity from the same promoter group. This one has been a bee in the bonnet for GFL’s stock for quite sometime. Promoters have committed to return this money to GFL by March 2023. Any other hanky panky in this area would be a show spoiler.
  • Disruption risk – If EVs start adopting other technologies owing to supply chain issues in PVDF / FKM and other fluoropolymers, this would lead to GFL’s business getting hurt. As of today, I haven’t been able to find any evidence to support this argument. But then technologies & supply chains can evolve rapidly given there is enough moolah involved, and one can never say for sure.
  • Fire hazards – Last year there was a fire at one of the GFL’s plants and that led to a shut down of that plant for sometime. Although it was covered by insurance, something similar happening again could spook investors.
  • Environmental hazards / gas leaks in the future.
  • LiPF6 business not kicking off as expected.
  • Other unpredictable risks – Risk is what is left over after we’ve thought about everything else.

More availability leads to more consumption

Charlie Munger once said “You’ll drink a hell of a lot more Coke if it’s always available.”

Charlie was implying the power of Coca Cola’s worldwide distribution network. Just because Coke is available everywhere, we tend to consume more of it. Imagine someone keeping a new Coke bottle at your and all your colleagues’ desks every day. Without doubt, it will lead to more sales for Coke, no matter how health conscious you or some of your colleagues are.

Here’s one more from one of my favorite self-help books.

“Environment is the invisible hand that shapes human behavior. Despite our unique personalities, certain behaviors tend to arise again and again under certain environmental conditions. In church, people tend to talk in whispers. On a dark street, people act wary and guarded. In this way, the most common form of change is not internal, but external: we are changed by the world around us.”

Atomic Habits

It’s easy not to read a book when the bookshelf is in the corner of the guest room. It’s easy not to take your vitamins when they are out of sight in the pantry. When the cues that spark a habit are subtle or hidden, they are easy to ignore. If you want to remember to take your medication each night, put your pill bottle directly next to the faucet on the bathroom counter. If you want to practice guitar more frequently, place your guitar stand in the middle of the living room. If you want to remember to send more thank-you notes, keep a stack of stationery on your desk. If you want to drink more water, fill up a few water bottles each morning and place them in common locations around the house.

Atomic Habits

Will something similar happen with EV adoption? What will happen when charging stations become available at more and more parking lots, malls, restaurants, offices and apartment car parks? Chances are high that if the external environment makes more charging stations available, it will lead to faster adoption of EVs.

And your guess is as good as mine on what kind of an impact this will have on the financials of EV beneficiary companies such as GFL.

Disclosure – I have a position in this company and my views are certainly biased. This blog is not to be construed as an investment advice. Please consult your investment advisor before investing.

Disclaimer: This is NOT investment buy/sell/hold advise. I am not SEBI registered. May change stance on above business anytime with new developments and/or new insights, and/or overall market conditions. May NOT be able to update periodically. Please do your own diligence and/or take professional advise, before investing.

Barath Mukhi
12-August-2022

Why focusing on a single metric can cost you a 6 bagger?

Case study – 1

Imagine your equity advisor told you to buy this pharmaceutical company’s stock in year 6. Considering that their cash flows aren’t reflecting the profits that are being declared by the company, would you still buy? (A consistent cash flow of below 8 bucks for every 10 bucks (80%) is generally considered not good)

And then you find out that cash flows are low because their receivable and inventory days have gone up 5x. Would you still consider buying, that too in the middle of a small/mid cap bear phase?

You decide to give the stock a miss, because the company’s working capital and cash flows aren’t looking good.

Much to your disappointment, the stock goes on to become a 6 bagger over the next 5 years, compounding shareholder wealth at a stunning 42% CAGR. What could you have potentially missed?

In my workshops I am often asked for a formula or an excel sheet that can help people spot life changing stocks. A related question that comes up rather frequently is how important is it to compare cash flow from operations vs profit after tax. And I am going to be deep diving into that aspect.

Note: This isn’t to pin point faults in any investor’s analysis. All of us are learning, and making mistakes is the tuition fee we pay to the market. And these case studies are vicarious experiences for normal mortals like all of us.

Case study 2 – Opto Circuits

In 2012, an investor wrote a blog about a very interesting fast grower called Opto Circuits. Here’s how Opto had been doing until then.

At 6 times earnings. This was a GARP investor’s dream come true. A 50% grower available at just 6 P/E.

Why was it trading at such low multiples? Perhaps it was because small & mid caps were in a bear phase or perhaps the market had doubts about the company’s cash flows or maybe it was a gold nugget waiting to be discovered.

In his blog post, this investor also mentioned Opto’s cash flows were worrying.

Yet, this risk was not given enough weight and this investor and many others who invested around that time, lost a big chunk because the market was right about the company’s shady accounting/business practices.

Investors who made a second mistake by not cutting their losses and stayed invested in Opto subsequently lost 98% of their capital.


The author subsequently accepted that his investment thesis had been broken at the hip, by writing another post mortem blog in which he reflected upon what had gone wrong. (To this person’s credit, not every blogger is bold/conscientious enough to do this. Unlike this blogger, some others just try to push things under the rug.)

Case 3 – Photoquip India

In another article published in a financial magazine, another investor talked about his experience with Photoquip India, which he picked up in 2011. Since this is a paid article, I don’t want to quote anything written in it. But the gist of the story is he trusted the management at face value, did a lot of scuttlebutt on the company/sector and yet ignored the fact that cash flows were lacking before, during and after he’d invested.

Now this was not some rookie investor. Instead he was the CIO of a PMS firm and somebody who’s experienced in many equity markets such as India, Sri Lanka, Bangladesh, Kenya, US, UK, Canada, Australia, and New Zealand.


And here’s the subsequent downfall in the company’s stock price. Even after a rare & phenomenal bull market like that of 2020-21, the stock is still down 70% after a decade.


So we have contrasting cases here. In case 1, the stock performed well despite low cash flows and in the cases of Opto & Photoquip, cash flow was the straw that broke the camel’s back.

Case 1 is that of Sun Pharma between 2005 (Year 1) & 2015 (Year 11).

In all 3 cases, cash flows were low and yet, the market was lenient towards Sun. So how were Sun’s lower CFO numbers different from Opto Circuits’ and Photoquip’s?

The answer lies in the following piece of wisdom from Albert Einstein.

In the case of Sun, a fanatic promoter drove cash flows back to high levels, from year 7 and Mr. Market said I am gonna be patient with this promoter for 6 years and I am not gonna count too much.

With Sun Pharma, the market believed in the promoter’s ability to eventually turn things around whereas Opto Circuits and Photoquip were cases of outright fraud. Mr. Market was perhaps smart enough to discount the fact that Opto & Photoquip would never grow their cash flows to sustainable levels.

The point I am trying to make is that one needs to look at the holistic picture, the grand scheme of things going on at a company. Perhaps we should not forego investing in companies if a single metric is out of whack, if other factors such as scuttlebutt feedback, management track record, competitive advantages available to the company are impeccable. Focusing too much on any single metric is the functional equivalent of paying too much attention to the scoreboard and not focusing enough on the playing field.

Yet, there are times, a single metric such as low cash flows become deal breakers, if other red flags start showing up. Perhaps some of these red flags would become obvious only after resulting in permanent losses of capital. As we can see, long term investing in equities will never boil down to a single formula, ever.

Case 4 – Laurus Labs in July 2020
Some investors were worried about Laurus’ receivables being high and chose to skip investing in its stock, at a time when it was available at one-fifth of it’s current price. In effect they were saying, Laurus’ future CFO would be impacted because cash would be stuck in receivables and some of those receivables would become bad debts and would therefore lead to cash flow problems for the co.

What they missed is that receivables in pharma usually don’t end up being bad debts and write offs because relationships between pharma cos and their clients are multi year and there is a lot of inter dependence. If one of Laurus’ large clients defaulted or delayed payments, Laurus could simply cut-off future supplies to that party and start recovery.

Besides who were these clients that owed money to Laurus? Were they some fly by night operators that would vanish into thin air some day? Or were these clients big MNCs that could potentially delay but not deny payments to Laurus? In my view, the answer was the latter and hence I took a big position despite their receivables being high, at 102 days at the time.

To conclude, like any other metric, a low CFO vs PAT can tell you there could be something getting cooked in the books. Yet, as the case of Sun Pharma shows, if the jockey is good, he can turn things around and a low CFO doesn’t become a problem then.

Too many times, we get stuck up on a single metric, and let go of some great opportunities, without looking at the grand scheme of things instead. If this isn’t analysis paralysis, what is?

Addendum – Case 5 – Zee TV during the TMT / Dotcom bubble phase

I was reading India’s Money Monarchs and this response by Mr. Samir Arora caught my attention, this morning (23rd Jan 2021).

Amazon.in: Buy India's Money Monarchs: Conversations with leading investors  Book Online at Low Prices in India | India's Money Monarchs: Conversations  with leading investors Reviews & Ratings

“If you look at our history, both the reason for success and the reason for criticism are the same, “You hold your stocks too long.” Zee, multiplied 160 times since we bought it. Every Rs 10 invested in the company had multiplied to Rs 1600. But we did not multiply our investment to that extent because by the time we sold, it had already fallen to Rs 700. So, we basically ended up multiplying our investment 70 times. I remember having said in an interview with one of the business magazines that our year-end target for Zee was Rs 250 when the price was around Rs 100. However, the stock had multiplied 10 times by the time the year had ended and we did not sell during the year. Even if I had sold at Rs 300, I would have tripled my money in a year and that would have been considered as a great job. While some might say that not selling at Rs 300 was a good decision, others might criticize me for not selling at Rs 1600.”

And then I looked at the numbers for Zee TV during those years and what I saw blew my mind.

Zee had a net cash flow of below zero while the TMT bull run was in progress. And the reason it’s insanely high receivable days. Zee was taking an average of 6 months to recover due owed to it by its customers.

Yet the market wasn’t worried because Zee went on to become a 100 bagger. Now I doubt how many people would have actually made 100x their money but we can at least get a rough idea of how things went.

Maybe the market was inefficient, back then. Or perhaps, it had a good enough reason because Zee’s profits had been growing at a very fast clip.

So yet again, we have a case where the market prioritized growth over balance sheet quality and cash flows and hence it makes sense to keep an open mind about all these metrics.

Disclaimer – Not SEBI registered. Not a recommendation to buy/sell any of the above mentioned stocks. Don’t hold any of the above either.

Barath Mukhi
7-Jan-2022

The drawbacks of using the PE ratio as a valuation tool

There’s this German company that makes a key component for automotive, aerospace, and industrial uses. The company initiated a restructuring program in Sep 2020. Due to rising costs, management wanted to reduce headcount & manufacturing capacity in Germany.

Here’s the press release from the company in Sep 2020.

Now, if we were to read between the lines, a big chunk of these jobs and production capacities would be moved elsewhere.

How do we know where these jobs are moving to? One, by reading between the lines and two with some data. First, let’s see what the management of the Indian listed entity of the same group, is saying.

So the Indian co. is saying, they will grow their exports but cannot reveal, at what rate. My guess is they either don’t have a go ahead from the parent due to geo-political reasons or perhaps it is an evolving situation and they don’t know themselves, what their German bosses have in mind.

Now let’s move to the data. A rising export trend, indicates that management is walking the talk and business is indeed moving to India and could be an indicator of things to come.

Now let’s look at, what sales look like for the German parent and for the Indian entity.

The German group’s worldwide sales are 29 times that of the Indian entity’s 3762 Crs, last year and that means there is a lot of room for growth here and scalability is not likely to be an issue.

Now, this is not a company that is struggling to sell its products. It is a company which is trying to cut costs and move jobs to lower cost locations such as our very own. In fact, it is an seven decade old company which holds a significant global market share in the segment in which it operates.

Risks

  • Plants are operating at full capacity and future growth relies on Capex. Current fixed assets = 1000 Crs. Capex for next 3 years = 1200 Crs.
  • German politicians are already doing everything they can to retain jobs within their geographies. As of today, cost economics are winning over politics and business is moving to India. This may or may not turn out to be the case, in the future.
  • Margins drop due to fluctuation in raw material prices. Although margins have stayed relatively stable for the company in the past, there is no guarantee that they will be able to pass on commodity price risks over to their customers in the future and remains a key risk for investors.

At the time of this writing, the business trades at 50 times earnings. For a business where things can change quickly, does it make sense to value the business based on a P/E multiple?

I’ll leave you with that thought.

Disclaimer: Invested in the Indian co. from lower levels. These are my views and are not to be construed as investment advice. As always, please do your own research before proceeding to buy/sell/hold.

Barath Mukhi
5th Jan 2022

Note to self on the current Chinese disruption

Let me just start by saying that my views are positively biased because I have stayed invested in this company since much lower levels.

This post is an attempt to articulate what I have learnt so far, about Indian Pharma.

We have all read recent news reports about the Chinese government cutting power to polluting factories in certain areas. These power supply cuts mean that the factories operating out of such provinces will have lesser capacity to produce goods and operate at a much lesser scale.

This change could mean that if Chinese manufacturers are unable to produce as much chemicals or APIs (active pharmaceutical ingredient) or Key Starting Materials, as before, there would be a shortage of these products across countries. This could possibly lead to higher prices of these products for whoever is able to make them and thereby result in increasing sales and margins. These manufacturers could be from China, India, Timbaktu or anywhere else.

In our case, it could either be beneficial or not, depending upon which side of disruption, the companies that we are invested in, are on.

What are Key Starting Materials (KSM)?

The textbook definition of KSMs – Critical input used in the manufacturing of an essential generic medicine, as well as ingredients or components that possess unique attributes essential in assessing the safety and effectiveness of such essential generic medicines, including excipients and inactive ingredients.

From Mr. Sajal Kapoor’s Twitter handle

From what I have understood so far, KSMs include stuff like Amines, Solvents, Reactants, Acids & Salts. Maybe there are things beyond this too.

With this background, let’s define the problem now. Raw material supplies for Pharmaceutical companies are likely to get hit and these shortages will lead to spikes in input costs.

Question – Who will be impacted negatively and who will be impacted positively, by this change?

There are certain products where Indian API manufacturers are completely dependent on China for APIs and KSMs. For instance, fermentation-based products like anti biotics, statins, vitamins etc. These players may see cost escalations in input costs of fermentation based products and some of them will pass it on to their end customers over time. Conversely, Pharma players without pricing power won’t be able to pass on these increased costs and their margins will get negatively impacted.

Since I am interested in Laurus Labs, I was worried about this angle and decided to deep dive.

What will happen if Laurus Labs is not able to pass on these price increases to their customers?

Here’s what I found.

This China problem is not new. It keeps cropping up every once in a while. They had a similar issue in 2019 as well.

And here’s how they handled it.

Let’s go back another year now. The year is 2018 and they were having the same troubles. Prices of key raw materials had gone up and Laurus was able to convert a challenge into an opportunity.

Based on the above events, one gets a gut feel that even if there are challenges in the supply chain, here’s a team that can do things, to resolve the issue.

Now let’s look at the situation from the vantage points of various stakeholders involved.

The Chinese factory owner: Last week it was the pollution control officers. This week it is the damn power cuts. How am I gonna pay my bills? How am I to pay salaries to all those people working on the shop floor? I am not sure how long I can sustain in this business.

The Indian Entrepreneur: There’s a plant closing down in China. I am sure there are opportunities out there for me to go out and grab, and thereby grow my business. While that happens, my margins could take a hit and let me keep my eye on the ball and focus on the long term.

The Customer: Everything was going so well and then thanks to all the polluting factories, I need to find another skilled guy in another business friendly geography where my supplies are guaranteed with equal or perhaps better quality.

Mr. Market: He is swinging in between what will happen in the next quarter and what will happen over the long term. On days when he is worried about the next quarter, he offloads his stake. And on days when he is focused on the long term economics of the business, he thinks “This China + 1 thing is real after all. More and more business could fall into this company’s lap. Let me just hold on to this business. Better yet, let me increase my stake in this business.”

Let’s look at some disconfirming evidence too. Below is one instance wherein they were unable to pass on price increases to their customers.

That being said, here are my conclusions.

  • Equity investing is not a science. Sometimes, we just need to stomach the volatility, the uncertainty & the self-doubt that accompanies falling stock prices. Particularly so, if the entrepreneur has a decent, execution track record.
  • Disruption in APIs isn’t new. It’s been there for a couple of years and is here to stay. And entrepreneurs who have handled it successfully before, could possibly handle it well in the future too.
  • What Mr. Market perceives as disruption, is perceived by the entrepreneur as an opportunity. There are times when blind belief in the entrepreneur is foolhardy. Yet there are times, when you need to go with your gut feel and just trust that the jockey will make things right.

You don’t want to be that guy who calculates too much and thinks too little.

Disclaimer: I have been wrong with my thesis in the past and could be wrong this time or in the future too. These are my thoughts today and could change as and when the situation evolves or whenever disconfirming evidence presents itself.

Barath Mukhi
11-Oct-2021

25 Small & Mid caps that did well despite the small cap index going down by 54%

I recently revisited an interview by Mr. Raamdeo Agrawal, where he said “I am very happy when the markets fall and I can buy something that adds more value to my portfolio. Markets don’t understand high quality value in the short term. Focusing on value is the key. What we have learnt is that the value of the company remains steady even if there are external events. Only the price changes. Till 1998 nobody knew about the index. People looked at only individual stocks. This focus on index has spoilt the game. We focus on value instead.

The question I am seeking an answer to is whether the index really matters or is it just plain noise and we should be focusing instead on what our portfolio companies are doing currently and expected to do in the future, while disregarding what the market does.

The idea behind doing this post is to explore what happens when a small or a mid cap investor buys a basket of growing small caps and does not worry about the small cap index or the Nifty or the Sensex or any other indexes, at all. And should one really worry about index levels if businesses we are holding in our portfolios are doing well regardless? Articulated differently, is time in the markets more important than timing the markets.

What kind of profits or losses would one encounter, if he/she bought small & mid caps in Nov 2010, when the small cap index topped out & held them until Aug 2013, when the index was down by 54% from its previous peak?

And here’s how the BSE Mid cap index moved during the same period. The mid cap index was down by 40% while the small cap index was down by 54%

Methodology used

  • Filtered companies that grew their profits by at least 15% in FY2009, FY2010 & FY2011.
  • Removed a handful of companies where charts are not available due to corporate actions such as delisting, mergers, etc.
  • Removed large caps since most of us are interested in small/mid caps only.
  • Analyzed the out-performers from this group.
  • Dividends excluded.

Note: Blue lines in each of the below graphs represent the BSE Small Cap Index while orange lines represent the corresponding stock.

Solar Industries
Estimated Market cap in 2010 – 1124 Crs
Outperformed vs the small cap index
62% absolute returns


Redington India
Estimated Market cap in 2010 – 3671 Crs
Outperformed vs the small cap index
Negative absolute returns


Apollo Hospitals Enterprise
Estimated Market cap in 2010 – 7628 Crs
Outperformed vs the small cap index
69% absolute returns


Va Tech Wabag
Estimated Market cap in 2010 – 2094 Crs
Outperformed vs the small cap index
Negative absolute returns


Cadila Healthcare
Estimated Market cap in 2010 – 16042 Crs
Outperformed vs the small cap index
Negative absolute returns


Vardhman Textile
Estimated Market cap in 2010 – 1977 Crs
Outperformed vs the small cap index
Negative absolute returns


Swaraj Engines
Estimated Market cap in 2010 – 599 Crs
Outperformed vs the small cap index
9% absolute returns


Cera Sanitaryware
Estimated Market cap in 2010 – 238 Crs
Outperformed vs the small cap index
180% absolute returns


Castrol India
Estimated Market cap in 2010 – 12893 Crs
Outperformed vs the small cap index
48% absolute returns


Mayur Uniquoters
Estimated Market cap in 2010 – 171 Crs
Outperformed vs the small cap index
89% absolute returns


Engineers India
Estimated Market cap in 2010 – 10029 Crs
Under performed vs the small cap index
Negative absolute returns


Jenburkt Pharmaceuticals
Estimated Market cap in 2010 – 40 Crs
Outperformed vs the small cap index
Negative absolute returns


Torrent Power
Estimated Market cap in 2010 – 17250 Crs
Under performed vs the small cap index
Negative absolute returns


Exide Industries
Estimated Market cap in 2010 – 14350 Crs
Outperformed vs the small cap index
Negative absolute returns


Indian Toners & Developers
Estimated Market cap in 2010 – 39 Crs
Under performed vs the small cap index
Negative absolute returns


Consolidated Finvest & Holdings
Estimated Market cap in 2010 – 297 Crs
Under performed vs the small cap index
Negative absolute returns


Superhouse
Estimated Market cap in 2010 – 79 Crs
Outperformed vs the small cap index
Negative absolute returns


R S Software (India)
Estimated Market cap in 2010 – 63 Crs
Outperformed vs the small cap index
177% absolute returns


Pennar Industries
Estimated Market cap in 2010 – 782 Crs
Under performed vs the small cap index
Negative absolute returns


Phyto Chem (India)
Estimated Market cap in 2010 – 6 Crs
Outperformed vs the small cap index
60% absolute returns


Narmada Gelatines
Estimated Market cap in 2010 – 41 Crs
Outperformed vs the small cap index
31% absolute returns


Shree Renuka Sugars
Estimated Market cap in 2010 – 21040 Crs
Under performed vs the small cap index
Negative absolute returns


Ushdev International
Estimated Market cap in 2010 – 1429 Crs
Outperformed vs the small cap index
Negative absolute returns


Kama Holdings
Estimated Market cap in 2010 – 352 Crs
Outperformed vs the small cap index
Negative absolute returns


P I Industries
Estimated Market cap in 2010 – 771 Crs
Outperformed vs the small cap index
140% absolute returns


Supreme Industries
Estimated Market cap in 2010 – 2078 Crs
Outperformed vs the small cap index
134% absolute returns


Torrent Pharmaceuticals
Estimated Market cap in 2010 – 4756 Crs
Outperformed vs the small cap index
58% absolute returns


Balaji Amines
Estimated Market cap in 2010 – 164 Crs
Outperformed vs the small cap index
Negative absolute returns


RPG Life Sciences
Estimated Market cap in 2010 – 182 Crs
Outperformed vs the small cap index
Negative absolute returns


Kaveri Seed Company
Estimated Market cap in 2010 – 486 Crs
Outperformed vs the small cap index
338% absolute returns


Veritas (India)
Estimated Market cap in 2010 – 1080 Crs
Under performed vs the small cap index
Negative absolute returns


eClerx Services
Estimated Market cap in 2010 – 1872 Crs
Outperformed vs the small cap index
50% absolute returns


Vinati Organics
Estimated Market cap in 2010 – 411 Crs
Outperformed vs the small cap index
8% absolute returns


Agro Tech Foods
Estimated Market cap in 2010 – 108 Crs
Outperformed vs the small cap index
54% absolute returns


Stylam Industries
Estimated Market cap in 2010 – 28 Crs
Outperformed vs the small cap index
Negative absolute returns


Garware Polyester
Estimated Market cap in 2010 – 641 Crs
Under performed vs the small cap index
Negative absolute returns


Atul Ltd
Estimated Market cap in 2010 – 579 Crs
Outperformed vs the small cap index
83% absolute returns


Somany Ceramics
Estimated Market cap in 2010 – 286 Crs
Outperformed vs the small cap index
35% absolute returns


Vidhi Specialty Food Ingredients
Estimated Market cap in 2010 – 21 Crs
Outperformed vs the small cap index
Negative absolute returns


Page Industries
Estimated Market cap in 2010 – 1565 Crs
Outperformed vs the small cap index
225% absolute returns


Thangamayil Jewellery
Estimated Market cap in 2010 – 240 Crs
Outperformed vs the small cap index
12% absolute returns

DHP India
Estimated Market cap in 2010 – 11 Crs
Outperformed vs the small cap index
Negative absolute returns


Sudarshan Chemical Industries
Estimated Market cap in 2010 – 468 Crs
Outperformed vs the small cap index
Negative absolute returns


Oriental Carbon & Chemicals
Estimated Market cap in 2010 – 142 Crs
Outperformed vs the small cap index
Negative absolute returns


Bajaj Electricals
Estimated Market cap in 2010 – 3640 Crs
Outperformed vs the small cap index
Negative absolute returns


DFM Foods
Estimated Market cap in 2010 – 106 Crs
Outperformed vs the small cap index
138% absolute returns


Ashoka Buildcon
Estimated Market cap in 2010 – 1994 Crs
Under performed vs the small cap index
Negative absolute returns


Manali Petrochemicals
Estimated Market cap in 2010 – 312 Crs
Outperformed vs the small cap index
Negative absolute returns


BASF India
Estimated Market cap in 2010 – 3023 Crs
Outperformed vs the small cap index
Negative absolute returns


India Motor Parts & Accessories
Estimated Market cap in 2010 – 303 Crs
Outperformed vs the small cap index
19% absolute returns


Gravita India
Estimated Market cap in 2010 – 351 Crs
Under performed vs the small cap index
Negative absolute returns


HSIL
Estimated Market cap in 2010 – 278 Crs
Outperformed vs the small cap index
Negative absolute returns


Caprihans India
Estimated Market cap in 2010 – 278 Crs
Outperformed vs the small cap index
Negative absolute returns

Dr Agarwals Eye Hospital
Estimated Market cap in 2010 – 40 Crs
Outperformed vs the small cap index
Negative absolute returns

Triton Valves
Estimated Market cap in 2010 – 103 Crs
Under performed vs the small cap index
Negative absolute returns

Simran Farms
Estimated Market cap in 2010 – 29 Crs (Can be considered a penny stock)
Under performed vs the small cap index
Negative absolute returns

Ramky Infrastructure
Estimated Market cap in 2010 – 2568 Crs
Under performed vs the small cap index
Negative absolute returns

Josts Engineering Company
Estimated Market cap in 2010 – 35 Crs
Outperformed vs the small cap index
Negative absolute returns

DIC India
Estimated Market cap in 2010 – 305 Crs
Outperformed vs the small cap index
Negative absolute returns

Educomp Solutions
Estimated Market cap in 2010 – 7708 Crs
Under performed vs the small cap index
Negative absolute returns

JMD Ventures
Estimated Market cap in 2010 – 297 Crs
Under performed vs the small cap index
Negative absolute returns

Nakoda Ltd
Estimated Market cap in 2010 – 570 Crs
Outperformed vs the small cap index
Negative absolute returns

Samtex Fashions
Estimated Market cap in 2010 – 53 Crs (Penny stock)
Under performed vs the small cap index
Negative absolute returns

SEL Manufacturing Company
Estimated Market cap in 2010 – 2 Crs (Penny stock)
Under performed vs the small cap index
Negative absolute returns

Silver Oak (India) Ltd
Estimated Market cap in 2010 – 6 Crs (Penny stock)
Outperformed vs the small cap index
10% absolute returns

Technofab Engineering
Estimated Market cap in 2010 – 192 Crs
Under performed vs the small cap index
Negative absolute returns

Pratibha Industries
Estimated Market cap in 2010 – 1912 Crs
Outperformed vs the small cap index
Negative absolute returns

Opto Circuits (India)
Estimated Market cap in 2010 – 7063 Crs
Outperformed vs the small cap index
Negative absolute returns

Him Teknoforge
Estimated Market cap in 2010 – 84 Crs
Outperformed vs the small cap index
142% absolute returns

Kwality Ltd
Estimated Market cap in 2010 – 3084 Crs
Outperformed vs the small cap index
Negative absolute returns due to suspected operator manipulation in the stock

IRB Infrastructure Developers
Estimated Market cap in 2010 – 3084 Crs
Outperformed vs the small cap index
Negative absolute returns

Fluidomat
Estimated Market cap in 2010 – 25 Crs
Outperformed vs the small cap index
39% absolute returns

Garden Silk Mills
Estimated Market cap in 2010 – 619 Crs
Under performed vs the small cap index
Negative absolute returns

Simplex Castings
Estimated Market cap in 2010 – 73 Crs
Under performed vs the small cap index
Negative absolute returns

Sacheta Metals
Estimated Market cap in 2010 – 154 Crs
Under performed vs the small cap index
Negative absolute returns

Mahalaxmi Rubtech
Estimated Market cap in 2010 – 417 Crs
Under performed vs the small cap index
Negative absolute returns

ARSS Infrastructure Projects
Estimated Market cap in 2010 – 3006 Crs
Under performed vs the small cap index
Negative absolute returns

Supreme Infrastructure India
Estimated Market cap in 2010 – 748 Crs
Outperformed vs the small cap index
Negative absolute returns

Inani Marbles & Industries
Estimated Market cap in 2010 – 44 Crs
Outperformed vs the small cap index
20% absolute returns

Jindal Hotels
Estimated Market cap in 2010 – 45 Crs
Under performed vs the small cap index
Negative absolute returns

Emmbi Industries
Estimated Market cap in 2010 – 39 Crs
Outperformed vs the small cap index
Negative absolute returns

Paramount Cosmetics
Estimated Market cap in 2010 – 20 Crs
Under performed vs the small cap index
Negative absolute returns

MBL Infrastructures
Estimated Market cap in 2010 – 1446 Crs
Under performed vs the small cap index
Negative absolute returns

XPRO India
Estimated Market cap in 2010 – 1446 Crs
Under performed vs the small cap index
Negative absolute returns

25 stocks that gave positive returns until 2013, despite the small cap index being half of what it was in 2010.

What was different between the companies that outperformed the index vs the ones that didn’t?

Here’s some data to chew.

13 Companies grew their sales by more than 15% throughout 2011, 2012 & 2013.

4 companies grew their profits by more than 15% throughout 2011, 2012 & 2013.

22 out of 25 companies had above average ROEs, throughout.

Now, some of the above companies might have had ongoing capacity expansion projects which might have optically suppressed their ROEs. Yet, these companies’ businesses and stocks continued to do well in what was perceived to be the worst possible time to get into small caps, in many years.

Let’s try some dis-confirming evidence now. First some data.

Total # of companies (small & mid cap) that grew PAT by at least 15% YoY in that period 95
Total # of companies that outperformed 25
Total # of companies that under performed 59
Total # of companies excluded due to corporate actions / lack of data 11

Did any of the companies that showed negative returns, have an ROE of 15% consistently? None. Zero.

Did any of the companies that showed negative returns, have consistent growth of more than 15% per annum? Again, the answer is no.

This would mean that ROE & growth are the engines which drive stock prices.

How can we make this study better?

If you have suggestions on how we can make this study better and as bias-free as possible, please drop me a note at barath@bigvisioninvesting.com or in the comments box below and I’ll try to see how best we can incorporate it.

Conclusions thus far:

  • Businesses (and stocks) can do well despite all odds. Imagine the pain you’d have gone through, had you sold one of the out-performers because of all the market related noise in the media, thereby trying to time the market.
  • Stock prices are driven by growth, ROE (& the US Fed) in the long run. And stocks of businesses which tick both boxes can do well, in the worst possible market conditions.
  • Focus more on the business is doing than on what the market indices will do.

I will do a similar blog for the next small cap cycle which happened from Jan 2018 to Mar 2020 (chart below), just to find out if these conclusions hold good in another time frame. Stay tuned.

Barath Mukhi
28-Sep-2021

Selling before it’s too late- The delusion of paper profits in a bull market

Selling stocks is exponentially more difficult than buying. If you sell a winner at the wrong time, you could have the financial regret of a lifetime. On the flip side, there were times I ended up kicking myself for not having sold losing stocks in time, thereby magnifying the somewhat inevitable smaller losses I would have otherwise had.

It takes quite a few trials and errors before one figures out how to sell stocks in time. And even after one thinks he’s got it, could still go wrong.

The context is that like a lot of my peers, I was anxious about how this current bull run will play out. Will we experience another bull market like the one we experienced between 2009 and Feb 2020? Or will the market correct from here? If yes, then I shouldn’t be repeating the mistakes from the last cycle and convert paper profits to cash.

Bear markets sneak in when most poor mortals aren’t expecting them and not when there is a lot of debate on Twitter about whether it will crash this week or the next or the one after that.

While I am no expert at timing the markets or the macros, let me give this a shot anyway. In the aftermath of the 2008 housing bubble, the US Fed’s balance sheet expanded multi-fold and all those newly printed dollars chased equities and markets, the world over, shot up. Will the same story play out yet again over the next decade or so? A layman’s guess would be yes.

And here’s what somebody who has a good handle on macros, said about liquidity. Stanley Druckenmiller (left), one of the guys who famously broke the Bank of England, along with his mentor, the legendary, George Soros (right), in a highly leveraged bet, once said,

“Earnings don’t move the overall market; it’s the Federal Reserve Board. Focus on the central banks and focus on the movement of liquidity. Most people in the market are looking for earnings and conventional measures. It’s liquidity that moves markets.”

With liquidity, earnings and the several moving parts that work in the background to keep the market engine running, it is hard to make a sure shot prediction about market direction. Think about how many people got out in time before the March 2020 crash and whether the same set of people had the nerve to get back in time before the markets ran up so suddenly.

I don’t think there are easy answers to when a bear market will come or if at all it will be in the near future. While I have been dealing with this uncertainty in my mind, I’ve simultaneously been reading How to make money in stocks by William O’Neil. For somebody like me, who loves reading financial history, this book is an absolute delight.

O’Neil is a genius. He collated fundamental and technical data of historical multi baggers, as early as the year 1885. And he put them into his mainframe computer in the 1960s to analyze what works on Wall Street. So this guy got his hands on a mainframe (remember there was no Windows then) to analyze stocks much before Bill Gates was famously dozing off on his desk, working on computers, in 1968. Woah!!

How O’Neil collated and analyzed so much data at a time when computers used to work like the ones below is quite fascinating.

Anyway, like a lot of other things in life, one naively ignored idea is that of looking at history and seeing how others solved the same problem I am facing today. And here’s how O’Neil solved the problem of being able to sell winning stocks in time. He wrote –

“Have you ever analyzed every one of your failures so you can learn from them? Few people do. What a tragic mistake you’ll make if you don’t look carefully at yourself and the decisions you’ve made in the stock market that did not work. You get better only when you learn what you’ve done wrong. This is the difference between winners and losers, whether in the market or in life. If you got hurt in the 2000 or 2008 bear market, don’t get discouraged and quit. Plot out your mistakes on charts, study them, and write some additional new rules that, if you follow them, will correct your mistakes and let you avoid the actions that cost you a lot of time and money.”

Hmmm.. so he looked at his past trades and so should I. I have this excel sheet where I note down all my buy/sell trades. And here’s what I figured out by doing a post mortem of my past trades from that sheet. There is a bit of hindsight bias here but we’ll just need to work with what we have.

Relaxo Footwears

  • I initially thought the stock will not do better than 15% returns per annum, and did not buy.
  • Big opportunity loss due to not averaging up. I was anchored to low valuations or my cost price perhaps.
  • Position sizing was not sufficient. Should have bought a lot more.

Nesco

  • Prematurely sold due to fear of losing out gains already made.
  • Did not apply second level thinking. Should have trusted management would fix the issue, because they would have solved the problem with their business sooner or later.

Kitex Garments

  • Should not have bought the stock in the first place. I wasn’t looking hard enough.
  • Averaging down did not help.
  • Should have sold when EPS fell down. Did not cut losses quickly enough.

Bajaj Finance

  • What worked – Buying when others were fearful.
  • What didn’t – Process gap. Not adhering to my stop loss.

Alkyl Amines

  • What worked – Experimental bet although it was outside my circle of competence.
  • What didn’t – Not following up. Not averaging up.

The way I look at it is, my journey has been through 3 phases.

Phase 1 – Where I was neither buying nor selling correctly
Phase 2 – Where I was buying somewhat correctly but not selling correctly
Phase 3 (Hoping I am in phase 3 today) – Where I am buying correctly [High allocation bets like Alembic Pharma (exited), Laurus & RACL have done well since March 2020] and hoping to sell correctly.

It is foolish to keep repeating mistakes and I now have pre-determined stop loss prices for all my long term bets and I am hoping this kind of a process allows me to convert paper profits into real currency. Having pre-determined stops also helps get rid a lot of bias and inaction that comes when the stop price actually arrives. I am hoping this helps me to transition from phase 2 to phase 3 smoothly unless I figure out there are more holes in my process.

Perhaps there is a phase 4 too, that I can’t visualise today. Having said that, I am glad to have made it this far, the future seems exciting and there’s a lot more yet to be accomplished.

Note to self:

  • Not backing up positions with enough capital, is a costly mistake. How many of your bets go right is less important than how much you allocate to the ones that go up. To quote Jeff Bezos, “Big winners pay for several failed experiments.” I seem to have fixed this mistake, by allocating 25% of my portfolio to Laurus Labs, last year.
  • Avoid slow or non-growth businesses altogether. Just doesn’t work for my investing personality type.
  • Not cutting losses quickly is a lacuna to be avoided.

Barath Mukhi
26th July 2021

A potential multi-bagger from an unexpected industry

Imagine you are a senior employee, at a company, with several years of experience and you know things are going like this.

By year 6, you know that the company’s equity has been wiped out and it goes into BIFR, a fancy name for potential bankruptcy proceedings.

Once it is clear that the chances of survival are almost zero, in most cases, employees are the first ones to flee a sinking ship because it is easier to switch to a different job than to go down with the ship. To understand the scale of losses incurred, there were no employees in this co. earning more than a lac a month, in year 6, at a time when it incurred a loss of 5.4 Crs.

In this context, I present to you the story of an entrepreneur who managed to save a business from dying. The above numbers are of RACL Geartech, an auto ancillary company that was about to go belly up in 2001 (Year 6). But, due to one employee and his team’s persistence, managed to survive.

A few years later, due to a stroke of good luck, he met a potential client (Kubota, a leading Japanese player in tractors) on a flight and convinced them to give a small order. And that resulted in a domino effect of being able to thrive in a sector that is famous for a lack of pricing power.

Gursharan Singh
Turnaround was led by current promoter, Mr. Gursharan Singh

The company came out of BIFR in Nov 2007. And here’s how they’ve turned around a business that had almost gone to the grave.

Sales have grown at 12% between 2016 & 2021, despite Covid lockdown impact
Profits have grown at 42% CAGR between 2016 & 2021

Higher margins were led by exports growing faster than lower margin domestic sales.

Higher exports also led to better returns on shareholders’ funds.

Clients

Most of the company’s growth has come from BMW, Kubota, KTM & Piaggio, which are all giants in their respective businesses.

Clients Piaggio Yamaha Kubota BMW KTM Honda

Typically, in such situations, the supplier gets squeezed. But this is not what happened in RACL’s case, indicating there is something more to this business than being just an also-ran auto ancillary player.

What would a new entrant need in order to compete with RACL?

Moat # 1 – Peer Margins & ROE

I ran a screen to check which auto ancillary companies have the best margins in the industry. RACL is the only growing co. which showed high margins coupled with high ROE over the last 2 years. In an industry with low or no pricing power, high margins and high return on equity are good indicators of a presence of a sustainable advantage over competition. Why else would no other names show up on the list?

Moat # 2 – Technical know-how

Lets think about it. Why would multi-billion dollar companies let a tiny supplier like RACL make high margins and high ROE, when they might as well go to other auto-ancillary co’s and give them lower margins?

Thomas Phelps, in his wonderful book, 100 to one in the stock market, said “Know-how is a competition reducer. The longer it takes to learn how to do what your company is doing, the fewer competitors will be around to do it for less.”

And here’s what management said about technological know-how in their maiden concall in Feb 2021.

Basically, they were saying, employees at their manufacturing plants have built their skill set over several decades. Plus, the machinery is prohibitively expensive. Even if another ancillary co. does put up the money to buy costly machinery, they will need to go through a learning curve, which could take many years. The other option is to poach a ton of employees from RACL, which is less likely because a lot of RACL’s employees have been around for decades and seem to be quite loyal to the co. I speculate, this is perhaps because the co. went through potential bankruptcy at some point, and led to a closely knit team.

To a potential new entrant, this would be like a chicken and egg problem. “Do we spend a ton of money on the machinery first or do we poach employees first?” I am not saying a new entrant can’t accomplish that. I am saying chances are less. Another thing to note is that the count of employees has been more or less the same over many years, despite all the growth, which possibly indicates very few employees leaving the co. for better and potentially risky opportunities.

Moat # 3 – Plant location

This is from the book “The Unusual Billionaires”.

“In the 1980s, Maruti used to give its suppliers thirty days of notice for the components it needed. Now, it instructs the supplier the previous night about the specific two-hour slot the next day when the components have to reach Maruti’s assembly line. It takes a new entrant into the Indian auto market many years, sometimes decades, to create a supply chain as efficient as this. That’s the power of architecture— it brings different companies together into a common network with a common goal in mind.”

The supply chains of global customers are considered super-efficient. A BMW or a Kubota, would want their suppliers’ plants to be in and around their own plants. But that is not the case with RACL. Forget being close to the customer’s plants, their plants are not even close to the port. RACL’s plants are located around Delhi, which is hundreds of kilometres away from the nearest port. If large OEMs are okay with a gear vendor being located hundreds/thousands of miles away (which is reflected in RACL’s growth over the last few years), it tells us something about RACL’s competitive advantage. No?

Gears for High end bikes

Moat # 4 – The gears that RACL makes require very high precision

This is based on hearsay and from another video made by somebody I haven’t interacted with, and hence I don’t know the source. So, take it with a pinch of salt if you want to 🙂

In 2014, KTM decided to launch a bike by 2017. RACL was given orders in 2014 and they delivered parts the same year. Before launch, KTM planned to run a bike for 50,000 KMS. The part failed after 47,000 KMS. This led to a delay in launch by 6 months. So, instead of KTM saying, we’ll fix it as we go, they said, we will wait until RACL fixes the issue, which they eventually did a few months later. Given this level of clients’ focus on precision, a new entrant is likely to encounter several technical roadblocks, over several years, before he cracks a contract to make high precision gears for a BMW, a KTM, a Kubota or any other large player.

Risks

The buzz word in auto nowadays is electric vehicles. This is perceived as a major risk for auto ancillary companies. But is EV a real risk?

Imagine you are a European who aspires to buy a luxury bike that costs several thousand Euros. Even in Europe, most salaried folks, can’t afford such high-end bikes. If you’re spending a bomb on an expensive luxury bike, what are you more likely to consider? Would you even think about the fuel economy that the bike provides? Would you not prioritise style and power and thereby not even consider an electric bike? I would imagine, somebody who considers spending that kind of money would almost certainly not worry about whether the bike is electric or not.

That being said, consumer preferences can change faster than we expect and EV adoption would stay a key aspect to track while staying invested in this co.

Another risk is that of high receivable days. RACL’s receivable days have trended in the range of 90-110 days, over the last 5 years, up from 27 days in 2016. Although 3+ months is a long time to recover cash from their clients, the good thing is that the trend has been flat, since 2017.

As per management, one of the reasons for receivables being high is that their plants are not located close to the port and that adds 15 days to the number. The usual number for exports is in the range of 60-70 days.

Typically, when receivables are high, businesses have trouble converting profits into cash. However, that is not the case here. RACL has been comfortably converting it’s reported profits to cash. Had receivables been taking a toll on the business, we would see much shorter orange bars, in the below graph.

Cash flow from operations
CFO vs PAT

Addendum –  I missed to add a key risk yesterday. Debt to Equity is on the higher side and is another risk to this business’ future prospects. Also, the co. plans to take on more debt to fund Capex in the next year or so and one will need to watch how well the co. is able to monetize the additional capacity they will be putting up, most of it using debt.

Debt to Equity

The icing on the cake is that current debt is equal to 2 years of FY 2021 cash flows and has been trending downwards. I don’t expect the co. to pare down debt in the next few years, given the huge growth expected. The only case where I foresee debt being reduced is either, when future cash flows are better than expected or the management decides to increase equity by issuing new shares (Equity Dilution).

Debt to Cash Flow

Scalability

RACL has several multi-billion dollar clients. BMW, for example, sold bikes worth 21000 Crs in 2019. And RACL’s annual sales is a paltry 1% of BMW’s. And this is just from one client. Will RACL be able to scale up their business multi-fold across geographies and across clients? Time will tell.

Another interesting thing that happened was that Kubota recently did a JV with Escorts and despite Escorts being the local partner did not bring in their own gear manufacturer. Instead the Japanese partner, Kubota, roped in their supplier, RACL. This is important because RACL’s big client is taking them along, into whatever newer markets they are going into. This opens up a very wide range of possibilities for RACL.

Capacity expansion during an industry down cycle

The co. announced Capex worth 50 Crs in FY2020 AGM. This is at a time, when their fixed assets were 100 odd Crs. Why would a co. that sells non-compulsory goods, increase capacity by 50% during a pandemic? It is not like they are selling roti, kapda, makaan, or anything close to that.

I think it is because they have high visibility for future orders, from clients, which is why they are taking such a huge risk of putting up 50 Crs, that too, 3/4th of it through debt.

Valuation

When it comes to valuation, the best thing one can do is to keep things simple, instead of using fancy excel models. I like to compare the earnings growth rate to P/E and here’s how it looks.

RACL vs NiftyRACLNifty
EPS growth – 5 years37%9%
P/E1429

RACL compares well to Nifty and most other indices in terms of earnings growth as well as it’s valuation.

Disclosure – I have a position in this company and my views are certainly biased. This blog is not to be construed as an investment advice. Please consult your investment advisor before investing.

Disclaimer: This is NOT investment buy/sell/hold advise. I am not SEBI registered. May change stance on above business anytime with new developments and/or new insights, and/or overall market conditions. May NOT be able to update periodically. Please do your own diligence and/or take professional advise, before investing.

Barath Mukhi
25th June 2021

Why is selling more difficult than buying stocks?

I have high regards for Peter Lynch’s investing wisdom. His investment track record was one of the best, of his era. An important thing that is most often missed, is that he achieved a 29% return over 11 years, despite having a big big handicap of not being able to invest more than 5% in his highest conviction bets, due to prevailing mutual fund rules, at that time.

And he was an investor who advised not owning more than 5 stocks in a DIY individual investor’s portfolio. Had the rules allowed him to back up the truck, to say 20% of Fidelity Magellan, chances are, he would have outperformed his peers by an even better margin.

Here’s what he wrote about his highest conviction bet, in the early 90’s.

During my final three years at Magellan, XXXX was the biggest position in the fund—half a billion dollars’ worth. Other Fidelity funds also loaded up on XXXX. Between the stock and the warrants (options to buy more shares at a certain price), Fidelity and its clients made more than $1 billion in profits on XXXX in the 1980s. This was the year I backed up the truck. Backing up the truck is a technical Wall Street term for buying as many shares as you can afford. Now 4 percent of Magellan’s assets were invested in XXXX, and toward the end of the year I reached my 5 percent limit. It was my largest position by far.

I’ll reveal the name shortly. Just stay with me.

Fannie Mae stock price

These kind of returns happened, because the company’s earnings per share grew at 18% CAGR over 15 years, from 50 cents in 1986 to $5.60 in 2001. Btw, he called this the best business in America. And, this came from an investor who compared it to thousands of other American businesses.

And yet, he seems to have lost money on this 27 bagger. The stock was that of Fannie Mae, which was the American equivalent of HDFC Home Loans in India. In a Sep 2008 article published in the Wall Street Journal, Lynch was expecting the beaten down Fannie Mae’s business to bounce back by 2011. By the time this article was written, Fannie Mae’s stock price was already down from a peak of $86 in 2001 to $2 in 2008.

WSJ article published in Sep 2008
Fannie Mae stock price

But then, just like with most hope based investing situations, Fannie Mae’s diluted EPS never recovered post GFC, and so did it’s stock price.

Basant Maheshwari Pantaloons - Bought at 7
went to 875
Sold at 300

Whether or not he ever sold his Fannie Mae position eventually, is not known. If an experienced investor as smart as Peter Lynch did not sell a winning position in time, it tells us how difficult endowment bias can make it for us to sell our ex-winners.

That led me to thinking what if he had sold his position much earlier, when the company’s growth had slowed down? Fannie Mae had not been doing well since 2003 anyway, as seen from their blue EPS chart above. Assuming he was holding a big position in Fannie Mae from 2003 to 2008, he would have saved a fortune by getting out of the stock once the company’s business had slowed down, say by 2006 itself, much before the price tanked all the way.

Now let me tell you a story of somebody who did not make the same mistake as Peter Lynch, and sold Pantaloons because the price had started tanking. He’d started buying Pantaloons at ₹7. The stock went up all the way to ₹ 875 and then when it came to ₹300, he sold the stock, a price it never went back to, ever again. Below, he explains his rationale.

What if I had stuck to selling at pre-determined stop loss prices, in the past?

Well I used to be this “buy and hold and forget” investor a couple of years back. But not any longer.

Kitex Garments mistake

I’d started buying Kitex Garments at 500 levels in Oct 2016 (not adjusted for splits) and then averaged down at 400 levels too. It is easy to hide under the garb of “buy and hold” despite the market giving you enough signals that you are wrong. Here’s what I had written in my trading journal, in Feb 2018, at a time when I should have been selling.

Journal

The same pattern has repeated for me in stocks like Bajaj Finance, Manappuram Finance, etc. and when I should have been selling these stocks, I didn’t – A mistake I am almost certain, not to repeat in the future. I now have a process wherein I set pre-determined alerts for stocks that I own. This takes out a lot of bias, when trying to cut losses quickly. So if and when the price of stock goes down below that level, I force myself to sell. Sometimes, it makes sense to think Mr. Market is smarter than you, control your risks and protect your limited capital.

Unknown Unknowns

Thinking about it, such a strategy could potentially protect my portfolio, from potential black swans in the future, such as the world wide web going down all at once, or a nuclear attack or a bio attack, another pandemic that is way deadlier than we are experiencing today or the US dollar blowing up or some freakin’ unknown unknown that nobody ever anticipated to begin with. I really hope none of these scenarios ever materialize but one can never know.

My own experience has been that problems in companies come from areas nobody anticipates. From 2014 to 2018, I had been invested in Nesco, the company that owns the lucrative Bombay Exhibition Center and a couple of IT buildings, which it leases out to MNCs. The problem eventually came from their exhibitions causing several hour long traffic jams outside the Bombay Exhibition Center. The problem was compounded by the fact that there was metro rail construction (an unknown unknown that no research analyst had anticipated) going on at the Western Express Highway and I got rattled out of my position despite having held the stock for 4 years. You could blame this failure on a lack of my thinking about second order effects. What I did not foresee was that when their kingdom was at stake, the management would use its contacts and all its liquid resources to resolve the problem quickly with the Bombay City Corporation.

Nesco sale

The other unknown that nobody anticipated for this otherwise foolproof business was Covid19. Not one analyst had predicted that a pandemic would put off returns for some this company’s oldest shareholders, by a few years, resulting in huge opportunity costs.

And here’s what Morgan Housel wrote about unknown unknowns in The Psychology of Money “Beyond the predictable struggles of running a startup, here are a few issues we’ve dealt with among our portfolio companies: Water pipes broke, flooding and ruining a company’s office. A company’s office was broken into three times. A company was kicked out of its manufacturing plant. A store was shut down after a customer called the health department because she didn’t like that another customer brought a dog inside. A CEO’s email was spoofed in the middle of a fundraise that required all of his attention. A founder had a mental breakdown. Several of these events were existential to the company’s future. But none were foreseeable, because none had previously happened to the CEOs dealing with these problems—or anyone else they knew, for that matter. It was unchartered territory. Avoiding these kinds of unknown risks is, almost by definition, impossible. You can’t prepare for what you can’t envision.

Some more anecdotal evidence

Here’s what Mark Minervini wrote in one of the Market Wizards books – “Were there any other major pivotal points in your transition from failure to success? After I had been trading for several years following my initial wipeout in the markets, I decided to do an analysis of all my trades. I was particularly interested in seeing what happened to stocks after I sold them. When I was stopped out of a stock, did it continue to go lower, or did it rebound? When I took profits on a stock, did it continue to go higher? I got tremendous information out of that study. My most important discovery was that I was holding on to my losing positions too long. After seeing the preliminary results, I checked what would have happened if I had capped all my losses at 10 percent. I was shocked by the results: that simple rule would have increased my profits by 70 percent.”

To conclude, this article is not to question a very smart investor’s wisdom but to understand how difficult investing in stocks, particularly selling, can really be, at times. And more importantly, how critical it is to cut your losses quickly rather than slowly. The difference between both can be night and day.

Barath Mukhi
30-May-2021

Buy and hold investing in India

Remember the market cliché about some of the best track records coming from those of dead people’s inactive portfolios? This comes from a supposed study that was done by Fidelity, in which they noted an internal performance review on accounts to determine which type of investors received the best returns between 2003 and 2013. The customer account audit revealed that the best investors were either dead or had forgotten about their portfolios.

From Business Insider

This happens because emotions and opportunity costs are not a factor in dormant portfolios. Does that mean, one should not try to maximize returns from one’s portfolio by switching to better ideas? I don’t think that would be the perfect thing to do, considering the dormant portfolio data. I’ll tell you why. Imagine you were an investor in Wipro in Feb 2000 and somebody told you about inactive portfolios doing better than the active ones and based on that you’d decided not to sell. You’d have had 20 years of zero returns while the indices ran up multi-fold.

Very few companies survive the relentless onslaught of competition, technology, changing consumer preferences, changing government regulations and various other factors. See for example, the below list of top 50 companies by market capitalization in 1992.

Most of the above got replaced by better, sexier, smarter companies. And, most of the ones that did survive in today’s top 50, did so because of issuing new shares. Take State Bank of India for example. From a market cap of 22900 Crs in 1992 to 318,000 Crs today, SBI’s market cap grew at a pitiful 9.5% CAGR. I am not even getting into equity dilution which would chop shareholder returns down to much lower single digits.

Or take ITC, a much debated hot stock. ITC’s market cap went from 9000 Crs to 2.6 Lac Crs, delivering a return of 12% CAGR, excluding dividends. That ITC would grow at a faster clip, 2021 onward, when it is 28x bigger, and is likely to be much more bureaucratic than it was in 1992, will possibly become a case study in hope based “long-term” investing, in the future.

Going back to 1992, as investors who believed in the India growth story, and who wanted to maximize their ROI, why would we have stayed invested in SBI/ITC when there were much better fish in the pond, provided one knew where to look? Shouldn’t we have been looking for faster growing high ROE companies, than the below large caps?

Company19922021CAGR (excluding dividends,dilution,spin-offs)
State Bank of India2290531878710%
Tata Iron & Steel13793863857%
ITC912825959412%
Reliance Industries6654131061620%
HUL636954460617%
Tata Engineering & Locomotive 5287N/AN/A
Associated Cement4924N/AN/A
Century Textiles400352251%
Grasim Industries36609249512%
Tata Tea3516N/AN/A
Tata Chemicals2986189587%
Larsen & Toubro294119633916%
Gujarat State Fertilizers Company2886N/AN/A
Colgate Palmolive27664186010%
Master Shares (Unit Trust of India)2699N/AN/A
Cochin Refineries2619N/AN/A
Industrial Credit and Investment Corporation of India (ICICI)2475N/AN/A
Chemical and Plastics India2133N/AN/A
Hindalco21047350013%
Bajaj Auto206910417414%
Brooke Bond India2060N/AN/A
Indo Gulf Fertilizers and Chemicals Corp1814N/AN/A
Gujarat Narmada Valley Fertilizers & Chemicals177944563%
Jaiprakash Industries1779N/AN/A
Shipping Credit Corporation of India1762N/AN/A
Bombay Dyeing168614680%
Essar Gujarat1683N/AN/A
Great Eastern Shipping Company166145134%
Tata Timkem153094476%
Nestle India150115977817%
Castrol India1479121668%
Century Enka1461549-3%
Indian Aluminium1452N/AN/A
Motor Industries1445N/AN/A
Britannia Industries13798441515%
Apollo Tyres1328142809%
Madura Coats1308N/AN/A
Gujarat Ambuja Cements11605855714%
Indian Rayon and Industries1144N/AN/A
National Organic Chemicals1134N/AN/A
Raymond Woollen Mills1124N/AN/A
Birla Jute Industries1120N/AN/A
Oswal Agro Mills1112132-7%
Ingersoll-Rand (India)110421162%
Mazda Industries1095N/AN/A
Siemens India10386444915%
Ashok Leyland10283348013%
VST Industries101710170%
ITC Bhadrachalam Paper1003N/AN/A
SKF Bearings (India)963107579%
Data not available for companies marked N/A

Suppose an investor forgot about his large cap portfolio in 1992, 29 years later, in 2021, he would have realized what a poor idea it was, to leave his portfolio dormant. The top performer, Reliance Industries, delivered 20% CAGR, excluding dividends, while most of the remaining companies either ceased to exist or delivered single to lower double digit returns. I am not getting into what happened to companies where data is not available. And I am not inclined to calculate dividends either because we want to look at the most efficient way of calculating returns quickly. My hunch is that, at best dividends would add 2-3% to the above returns. It is not rocket science to understand that active investors who kept learning about companies did much better than the cumulative returns delivered by this dormant portfolio, including dividends.

Conclusions

  • The answer to Buy and hold vs Buy and forget lies somewhere in between. Continue to hold companies that keep executing. For the ones that don’t, switch to better alternatives, because opportunity costs are real.
  • Buy and monitor beats Buy and hold any day. As Ian Cassel says “Fall in love with companies that execute but be prepared to divorce quickly.”
  • The above data is only for large caps. People typically invest in large caps for the certainty and clarity, the big companies provide. I agree with Ken Fisher, who once said “Clarity is almost always an illusion—a very expensive one.” As ROI focused investors we are better off investing in mid and small caps, even after adjusting for the risk involved in smaller companies.
  • Most things in the market are contextual. What works in the west doesn’t always work in India. Buy and hold may have worked in the case of Fidelity’s investors who forgot/were dead. It certainly has not worked in Indian large caps.

Barath Mukhi
30th-March-2021

How depressed markets can cost you money

This is a case study of how a lot of investors missed a big trend in Indian markets, costing them a 25+ bagger and how we can avoid falling prey to such a trap, ourselves.

Bull markets can delude one into believing that good times will continue. Likewise for bear markets. In bear markets we may start to believe that things around us are gradually getting worse when they could actually be getting better. This notion is compounded by the fact that everybody around us is bearish and negative about the future state of the economy and the markets. As investors, it is our job to keep our eyes on the ball (data) and not lose focus by believing what everybody else is saying.

Imagine what might been on investors minds, after reading scary headlines, such as these.

This image has an empty alt attribute; its file name is image-1.png
Economic Times article from May 2002

Imagine that the Sensex goes down from 50000 to 31000, over the next 3 years. What effect will it have on your psyche?

Sensex – March 202150000
Sensex – March 202237500
Sensex – March 202336750
Sensex – March 202431973

Yet, this is exactly how it played out in the 500+ trading days between 2001 & 2003, in percentage terms.

March 31, 2001-25%
March 31, 2002-2%
March 31, 2003-13%

Most investors are likely to have lost both, the money and the confidence in the above kinda market. Some of us may think, yeah the market rises, every time it falls and we might have just kept buying, had we been investors back then.

However, this ignores the psyche of most investors of that era. In 2000, just when the market was starting to forget the Harshad Mehta scam of 1992, and investors would have been less worried about manipulation, came another blow to their faith in the markets, in the form of the Ketan Parekh scam of 2001. And after they or their peers lost money, some of them are likely to have believed, Indian markets will never change and there will always be scams like these.

Also, in 2001, FIIs started to pull money out, after the Sep 11 attacks on WTC. Back then, FIIs were considered the major drivers of stock prices in India, because collectively, they had the muscle to move markets whichever way they wanted and FIIs selling could mean just one thing.

Investors were perhaps twice bitten, thrice shy (First Harshad, then Ketan). This was an era where the internet was still a luxury and wasn’t considered too important. Information flow wasn’t as smooth as, it is today. Perhaps, not many would have foreseen the impact, the introduction of demat and online trading would have, on making it harder & harder to manipulate the markets at the scale of previous scams. Even today, some old timers believe the market is a gambling den, thanks to historical scams like these ingrained in their memory and to a genetically programmed human emotion, called loss aversion.

Enter, the era, when mobile phones went from being a luxury to becoming a need, and landlines were still the norm. To put things into perspective, this bulky phone, the Nokia 6600, a rage back then, thanks to it’s relatively lower price tag and the all new camera feature, was launched in India, only in Oct 2003 and it took some years for it to be widely accepted.

This image has an empty alt attribute; its file name is image-2.png

So, in the middle of all these things, in 2003, why would you want to put your money into a company whose losses had kept increasing for 4 years? It also had a seemingly insane market cap, of 5000 Crores.

This image has an empty alt attribute; its file name is image-4.png

Investors were also expecting this company to continue making losses for the next few years.

This image has an empty alt attribute; its file name is image-5.png

Yet the stock price started moving up and went on to become a multi bagger over the next few years.

This image has an empty alt attribute; its file name is image-3.png

This is a story about Bharti Airtel. And here’s how one very smart investor kept his ears to the ground, thought differently and made solid money from this stock.

Raamdeo Agrawal’s investment thesis “Bharti Airtel was a big investment for us. It was a combination of two frameworks – value migration from fixed line to wireless phone and the network effect. In network business, the winner takes it all. The number one player makes 80% of the profits and the number two player 15%. I had read this in Michael Mauboussin’s book. In 2003, Bharti was making losses. In Jan 2003, Bharti’s CMD, Sunil Bharti Mittal, announced on the analyst call, that they had started breaking even. I did a five year excel spreadsheet analysis and deduced that they will make Rs. 28 thousand crores, cumulative PAT, in the next 6 years. The cash flows were expanding, the operational cost was fixed and there was a ten year tax holiday. The market cap was just Rs. 5000 Crs then. In life, you get very rare opportunities like these when the market is blind to the numbers. The market was also very depressed in 2003, which contributed to the under valuation. We bought the stock at Rs. 12.5 (adjusted) and it went to Rs. 590 within 3 to 4 years, but I did not sell then. I sold the stock at Rs. 325, when they bought businesses in Africa. So, it was still 25x. Investments like these give you the confidence that your frameworks work. In earlier times, just buying stocks at cheap valuations, made money. But the world has changed. You cannot just buy cheap and do well. You have to buy quality stocks with growth at cheap valuations.”

His investment thesis was a lollapalooza, where multiple mental models came together, which isn’t practically easy to do, by the way. Perhaps there are more models, but here are the ones that come to my mind.

  • Network effects (Pat Dorsey)
  • Loss to profit company (Ben Graham)
  • Using spreadsheets which are frowned upon otherwise (Mr. Agrawal projected a PAT of 28000 Crs. Actual number 22000 Crs)
  • Focusing on the story and not on numbers (RK Damani’s HDFC Bank example?)
  • Operating leverage once fixed costs are covered
  • Focusing on Cash flows (Buffett)
  • Mr. Market was depressed (Ben Graham)
  • Focusing on quality + growth and not just cheap valuations (Munger)

Focusing on cash flows instead of profits

This image has an empty alt attribute; its file name is image-6.png

Conclusions

  • Depressed markets can impact investors’ judgements, even without they realising it. Why else would somebody ignore a massive change in consumer preferences, that was very evident (in hindsight)? If there is a multi-year bear market in the future, keep your eyes and years open. Do not forget that, things will eventually get better.
  • Do not underestimate the effect, negative news flow from social media, can have on your psyche.
  • Buy what you see isn’t always easy.
  • Keep an eye on companies which are reporting losses, yet are cash flow positive.
  • Growth + Quality + Reasonable valuations due to Mr. Market’s bias = Multi baggers.

Barath Mukhi
1st April 2021

%d bloggers like this: