Why investors didn’t buy Infosys when it was a small cap

Let’s do a thought experiment. It’s August 1997 and you are in the trading ring at the Bombay Stock Exchange. In between the chaos of that place, there are thousands of listed companies. An investor friend, tells you “Buy Infosys”. You are unconvinced and don’t buy because you’ve burnt hands buying stocks recommended by others before. And you forget about the co.

The question I am seeking an answer to is – If Infosys subsequently became a mammoth wealth creator, why didn’t a lot of investors buy it in the early 90s? What biases were involved in causing the massive opportunity loss that followed, due to not buying the stock of this co.?

Let’s go back in a time machine. Here’s what it looked like in mid-1997.

*PAT Data not available for 1992

ROE for all 5 years kept increasing YoY and ranged between 21% and 33%.
The P/E ranged between 15 & 25.

Infy also had a 15 year track record of growing sales at 28% CAGR from 1982 to 1992. So even in 1997, it was not some microcap co. with no track record. It was a fast grower for 15 years, with decent credentials.

Let me quote what some veteran investors have said about Infosys and other technology companies of that era.

Basant Maheshwari – “Between 1994 to 1998, Infosys came right under my nose. We saw their good results, but there was always these thoughts like – “Who would buy Infosys if you take away all their employees tomorrow?” or “It only has computers and chairs and what are those worth for?” or then “I can create an Infosys by hiring all those people.”

Anil Goel – “I had never invested in IT companies. I didn’t understand that business and I did not understand the valuations. The valuations just did not make any sense. The market cap of one Computer Education Company exceeded the combined market cap of the few large conglomerates at that time. That saved me from technology crash of 2000.”

Here’s how the company’s market cap went ballistic, 1997 onwards.

1997 to 1999 – 19 x
1997 to 2000 – 127 x (not excluding new shares issued)

What would have happened if one had purchased the stock in 1997 or prior to that?

Assuming most people could not sell Infy at it’s peak, they would have still done well, had they bought the stock prior to 1997 and sold it post-crash, in 2001.

The point I am trying to make is, just like one cannot be right all the time, one also cannot be wrong all the time either. What was a growth stock for 6 years (1993 to 1999), became a bubble stock in 2000 and most people who bought in 2000, were likely to have been nastily injured. Had one purchased the stock any time between 1993 and 1998, they’d still have done well.

Ramesh Damani, who understood Infy, due to his technology background and made a ton of money from it’s stock, said “Lot of the old hands in Dalal Street didn’t understand technology since there were no physical assets, and all the real assets walked out at five in the evening. They had no idea how to value these companies.”

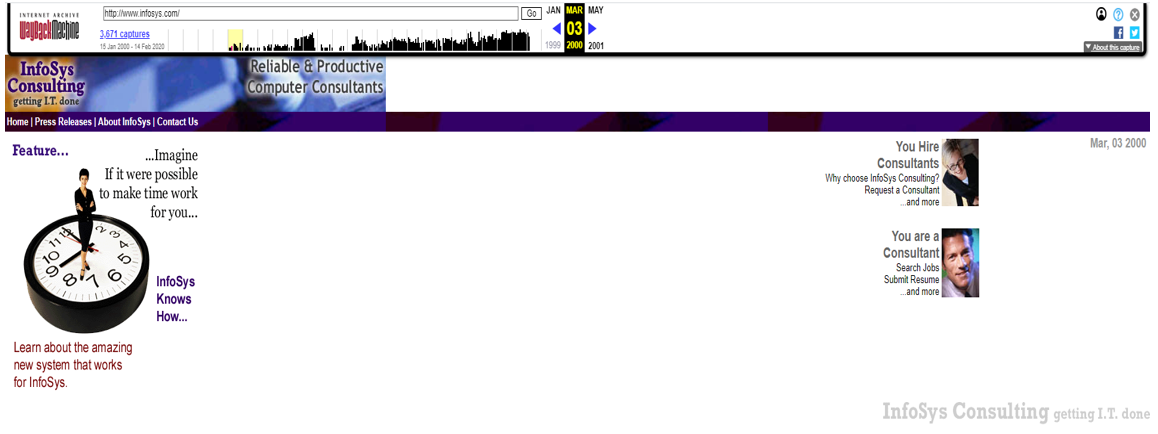
Would it have been easy to buy this stock without a tech background? No. As a wise investor once said “The risks of this trade always appear lower, after the rewards have been made.” Here’s what Infy’s website looked like in 2000. No investor relations. No annual report PDFs. This was the world back then.

Now let’s look at the situation from the perspective of an investor who had NO tech background.

I am not trying to find fault with investors who didn’t invest in Infy. I totally respect the wisdom, the investors I’ve quoted, have. I am just trying to present the situation from various vantage points, as investors saw it back then.

Here’s what Raamdeo Agrawal’ investment thesis in Infy was, in 1997 (I have shortened & rephrased this a bit). He had NO tech background, just like most people of that time.

“In the Y2K boom, we made Rs. 100 crore. We were 80% invested in technology, 40% of which was in Infosys. Mr. Narayana Murthy taught us that Indian cost was unbeatable. What Americans were doing in Boston for the last 20-30 years, Infy was doing for 1/5th or 1/6th the cost. Due to a friend’s suggestion, to learn about globalization, I started reading The Financial Times, The Economist, Business Week and Fortune. Somewhere in 1997, I read about the effects and challenges of Y2K. It explained what problems would occur when the systems would change from 1999 to 2000 and how it will need to be changed in computer systems for continuity of various industries. I could see a big elephant approaching and that the gate is small. And that it is a dated event. In the market, you rarely get to know about a future event that is dated, that this transition has to happen in just 3 years. The demand was high and the supply was not as much. The IT companies were growing at 100%, but were still available at 20 P/E in the beginning.”

Y2K as cover page on the Time magazine

Selling a bubble stock

Ramesh Damani – “When we saw that the 2000 Technology, Media & Telecom (TMT) bull market was getting over, I realized that these values wouldn’t hold. Infy was trading at 150+ forward P/E. Even if you try to hold the stock, the markets rattle you out of the position. Infy went up three straight circuits to Rs. 13,000 and then started falling. So when it fell to Rs. 8,000-10,000 levels, I sold it, as I could not handle the stress of holding it since so much money was involved.”

Raamdeo Agrawal -“When these companies were trading at 100-200 P/E, we did start selling. I started selling Infy at 11,000 per share. And I sold the last bit in September 2001, at around 2,500.”

Rajashekar Iyer – “My 1995 experience had taught me that when stocks are highly overvalued and start declining, the safe course is to sell them and not be a ‘long term investor’. All IT stocks were tremendously overvalued by Jan 2000 and so when they started falling in February, I sold them as quickly as I could. I could not sell at the peak, mostly 15% down from the peak. One IT company’s stock that I had bought at Rs. 60, came down from Rs. 510 to Rs. 360 by the time I could sell. I sold it almost 30% down from the peak, but it finally ended at Rs. 12.”

Conclusions:

  • For most investors, it takes a lot of time to adapt to new business models created by the arrival of new technology. Learning about these new business models quickly is sometimes the difference between great returns and mediocre returns.
  • Holding such investments is never easy. Think how difficult it is, to own Bitcoin today, given all the noise. I don’t own it btw.
  • Having bought early, if you find yourself invested in a bubble, stay put. Booking some profits intermittently and keeping trailing stop losses may be a good strategy, although stop losses may not help at times, given that there could be severe gap downs and no buyers.
  • Cut losses quickly. If you don’t, you may find yourself holding a loser for 8 years. (It was not until 2008, when Infy crossed it’s 2000 high price).
  • No matter how good a business or a management team is, at some price it becomes stupid to buy it.

Barath Mukhi
6th-March-2021

Will a market crash materialise soon?

Are Indian markets overvalued based on historical stats? That’s the question I’ll try to answer using historical data. While past data can be used as a map to understand what could possibly occur in the future, we must be wary of the idea that the same data can actually make us overconfident, compared to people who consider it risky to drown in such data.

I have collated the below vantage points, based on multiple articles/books I’ve read over the years. Hence, I thought let’s try to attack the problem from multiple angles instead of being a man with a hammer =D

Total Market cap of BSE companies

Let’s start with the total market cap of BSE companies (data available on BSE’s website). If we were to consider returns between peak market cap in the previous market cycle and today, the returns have been 16.7% CAGR, which is on the higher side. Conversely, from the previous top to the current top, the CAGR works out to 10.9% which isn’t a great return, considering risk-free interest rates during the same period.

Nifty P/E ratio

Nifty P/E, a widely tracked data point (or at least it used to be), is up from a low off 11 in 2009 to 39 in Jan 2021.

Let’s look at the “E” in the P/E ratio.

Nifty’s earnings per share have tanked by 20% from their peak of 452 in Jan 2020 to 364 today. If we were to assume Nifty’s earnings will be back to pre-covid levels, Nifty50 would still trade at 32 times earnings (14530 divided by 452).

32 P/E for the Nifty is still high by historical standards. Why then, is the market discounting Nifty’s earnings to the moon? I have 4 possible theories.

  1. Margins of Nifty companies are subdued (which is possibly why Nifty’s P/BV is low although Nifty P/E is high) and the market is expecting margins to bounce back at some point, leading to faster than expected EPS growth, from current levels.
  2. The market is predicting a healthy future state of the economy and not the other way around.
  3. The US Fed is printing $1.2 Billion (₹ 8700 Crores) everyday and all of that money is chasing assets like Bitcoin, Emerging market equities like the Nifty50 & Technology stocks in the US and other countries. The prices of these assets are probably being driven up by the TINA factor (There Is No Alternative – Read on Valuepickr)
  4. We are in a bubble and people inside the bubble don’t realise they are inside it.

Nifty’s Price to Book Value

Starting from the aftermath of the Global Financial Crisis in 2010, Nifty’s Price to Book has been in the range of 2.6 to it’s current 4.0, indicating we are in a bull market and not necessarily in a bubble market. Effectively, a low P/BV means, the assets of Nifty companies have grown, but are yet to produce the earnings they are supposed to produce (perhaps due to subdued margins or lower than usual asset turns) and Mr. Market is smart in discounting this factor.

Low interest rates

What do low interest rates mean for equity investors? In a recent interview, Warren Buffet said “think of it, the ten-year (Bond) at 1.4% that means you’re paying 70 times earnings for something that can’t increase its earnings for ten years.

This means, investors in the US can either:

  1. Invest 100 bucks in a US treasury bond and get 1.4 bucks per annum as interest, with zero capital appreciation in the price of the treasury bond. This also results in permanent loss of capital, in terms of reduced buying power, thanks to the demon called inflation.
  2. Take some risk with the same 100 bucks and buy equities at P/Es much lower than the 70 P/E that the US Treasury Bond is currently available at. Better yet, they get to expect some growth in the earnings of businesses that you are buying.

What would you rather do? I think it’s fairly clear, most enterprising people would choose option 2.

In the Indian context, current Gsec yield is 5.8% – This means you can either buy a Gsec, guaranteed by the Govt. of India, at 17 P/E and are assured of no growth for 10 years or you can buy a basket of stocks at sub 20 P/Es and can hope for at least some growth over the next decade.

Source – Zerodha

Market cap to GDP

The market cap-to-GDP ratio has been volatile as it moved from 85% in June 2018 to 58% in April 2020 and now stands at 98% FY21 GDP.

There were instances in the past, when this ratio hovered around 130%+ levels.

Critics of the Mcap to GDP ratio say, it doesn’t apply to India because the market cap does not capture MSMEs which contribute a significant chunk to India’s economy. Two, a good number of large and highly successful businesses prefer to remain private in India for reasons such as lower compliance requirements and easy availability of private capital.

Demat accounts

When people no longer have colleagues/bosses peeping into what is on their monitors, they behave differently. The lock-down induced work from home culture brought a new generation of first time traders/investors to the market in 2020 and the same is reflected in the upward trajectory seen since April 2020. India has added 80 lac new demat accounts between the lockdown and today!

Mutual Fund SIP inflows

Mutual Fund SIP inflows between June 2018 and Jan 2021 have grown at 5.8% CAGR. Think about the feedback loop created by these inflows. Higher inflows lead to higher stock prices which in turn leads to even higher inflows.

Let’s look at the MF SIP data in another way. Pre-Covid peak monthly SIPs were in Feb 2020 (8641 Crs). If we were to assume this peak SIP amount from Jan-Mar 2021, here’s what the annual SIP data would look like. Based on this assumption, the below chart tells us, SIP inflows, which is one of the indicators of investors’ faith in the future of our country’s businesses isn’t even back to Pre-Covid levels.

Large cap vs Mid cap vs Small cap

The above 3 charts illustrate that although Nifty50 has been going up, the Nifty Midcap 100 index has been flat while the Nifty Small cap 100 index is still down by 23% from it’s previous highs, achieved in Jan 2018.

For the sake of an example, at the start of this month, we recommended a small cap auto ancillary company to our clients which has gone up by significantly (thanks to all time high sales posted by the co. recently) within the last month and is still available in lower teen multiples of it’s last 4 quarter’s earnings. This means, there are still opportunities out there, in the small cap space, waiting to be tapped.

The mother of all – Liquidity & The Federal Reserve Board

As Ravi Dharamshi, of ValueQuest, recently said about the effect of all the new dollar bills being printed, and assuming history will either repeat or rhyme, yet again, what will be the consequences of a ballooning US Federal balance sheet, over the next few years?

Conclusion

  • Nifty P/E could be an incorrect indicator of market valuation, particularly so, during extreme events such as Covid19
  • The market’s Price to book is still not outside the “normal” range.
  • Opportunity costs matter – Low interest rates equal higher PEs for equities.
  • Market cap to GDP is on the higher side, but not necessarily obscene. And this is despite a subdued economy.
  • First time investors/traders got introduced to the markets due to lockdown and subsequent work from home culture.
  • Mutual Fund SIPs back to Pre-Covid levels.
  • There’s still some value left in the small cap space and in certain mid-caps.
  • The markets are probably discounting higher future market caps, thanks to an exploding US Fed balance sheet.
  • The difficult part of a bubble is not noticing it, but timing it.
  • We are in a bull market, but not necessarily in a bubble. If you have conviction in the long term future of businesses that you’re invested in, stay put.

Timing the crash

For those of you smarties, who’d like to time the crash, here’s what Cory Wang of Bernstein Research, noted recently after analyzing documents dated right before the dotcom bubble burst in 2000 – the hard part of a bubble is not noticing it. The hard part is timing it. You could be wrong for a while, before you may or may not be eventually right. And you could turn out to be right, for the wrong reasons.

Barath Mukhi
18th-Jan-2021