Case study – 1
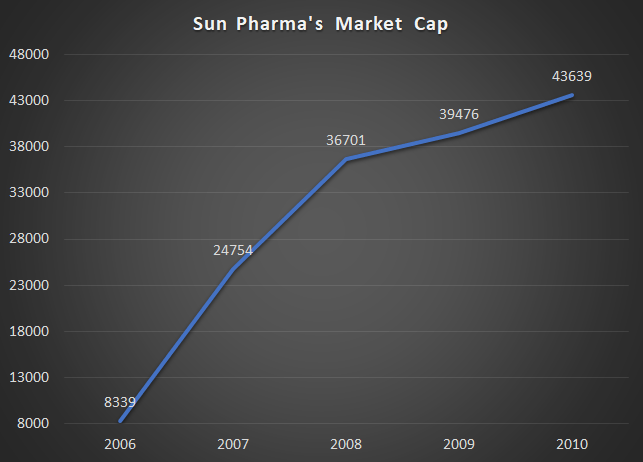
Imagine your equity advisor told you to buy this pharmaceutical company’s stock in year 6. Considering that their cash flows aren’t reflecting the profits that are being declared by the company, would you still buy? (A consistent cash flow of below 8 bucks for every 10 bucks (80%) is generally considered not good)

And then you find out that cash flows are low because their receivable and inventory days have gone up 5x. Would you still consider buying, that too in the middle of a small/mid cap bear phase?


You decide to give the stock a miss, because the company’s working capital and cash flows aren’t looking good.
Much to your disappointment, the stock goes on to become a 6 bagger over the next 5 years, compounding shareholder wealth at a stunning 42% CAGR. What could you have potentially missed?

In my workshops I am often asked for a formula or an excel sheet that can help people spot life changing stocks. A related question that comes up rather frequently is how important is it to compare cash flow from operations vs profit after tax. And I am going to be deep diving into that aspect.
Note: This isn’t to pin point faults in any investor’s analysis. All of us are learning, and making mistakes is the tuition fee we pay to the market. And these case studies are vicarious experiences for normal mortals like all of us.
Case study 2 – Opto Circuits
In 2012, an investor wrote a blog about a very interesting fast grower called Opto Circuits. Here’s how Opto had been doing until then.


At 6 times earnings. This was a GARP investor’s dream come true. A 50% grower available at just 6 P/E.
Why was it trading at such low multiples? Perhaps it was because small & mid caps were in a bear phase or perhaps the market had doubts about the company’s cash flows or maybe it was a gold nugget waiting to be discovered.
In his blog post, this investor also mentioned Opto’s cash flows were worrying.

Yet, this risk was not given enough weight and this investor and many others who invested around that time, lost a big chunk because the market was right about the company’s shady accounting/business practices.
Investors who made a second mistake by not cutting their losses and stayed invested in Opto subsequently lost 98% of their capital.

The author subsequently accepted that his investment thesis had been broken at the hip, by writing another post mortem blog in which he reflected upon what had gone wrong. (To this person’s credit, not every blogger is bold/conscientious enough to do this. Unlike this blogger, some others just try to push things under the rug.)
Case 3 – Photoquip India
In another article published in a financial magazine, another investor talked about his experience with Photoquip India, which he picked up in 2011. Since this is a paid article, I don’t want to quote anything written in it. But the gist of the story is he trusted the management at face value, did a lot of scuttlebutt on the company/sector and yet ignored the fact that cash flows were lacking before, during and after he’d invested.
Now this was not some rookie investor. Instead he was the CIO of a PMS firm and somebody who’s experienced in many equity markets such as India, Sri Lanka, Bangladesh, Kenya, US, UK, Canada, Australia, and New Zealand.

And here’s the subsequent downfall in the company’s stock price. Even after a rare & phenomenal bull market like that of 2020-21, the stock is still down 70% after a decade.

So we have contrasting cases here. In case 1, the stock performed well despite low cash flows and in the cases of Opto & Photoquip, cash flow was the straw that broke the camel’s back.
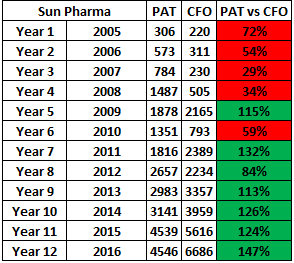
Case 1 is that of Sun Pharma between 2005 (Year 1) & 2015 (Year 11).

In all 3 cases, cash flows were low and yet, the market was lenient towards Sun. So how were Sun’s lower CFO numbers different from Opto Circuits’ and Photoquip’s?
The answer lies in the following piece of wisdom from Albert Einstein.

In the case of Sun, a fanatic promoter drove cash flows back to high levels, from year 7 and Mr. Market said I am gonna be patient with this promoter for 6 years and I am not gonna count too much.
With Sun Pharma, the market believed in the promoter’s ability to eventually turn things around whereas Opto Circuits and Photoquip were cases of outright fraud. Mr. Market was perhaps smart enough to discount the fact that Opto & Photoquip would never grow their cash flows to sustainable levels.
The point I am trying to make is that one needs to look at the holistic picture, the grand scheme of things going on at a company. Perhaps we should not forego investing in companies if a single metric is out of whack, if other factors such as scuttlebutt feedback, management track record, competitive advantages available to the company are impeccable. Focusing too much on any single metric is the functional equivalent of paying too much attention to the scoreboard and not focusing enough on the playing field.
Yet, there are times, a single metric such as low cash flows become deal breakers, if other red flags start showing up. Perhaps some of these red flags would become obvious only after resulting in permanent losses of capital. As we can see, long term investing in equities will never boil down to a single formula, ever.
Case 4 – Laurus Labs in July 2020
Some investors were worried about Laurus’ receivables being high and chose to skip investing in its stock, at a time when it was available at one-fifth of it’s current price. In effect they were saying, Laurus’ future CFO would be impacted because cash would be stuck in receivables and some of those receivables would become bad debts and would therefore lead to cash flow problems for the co.
What they missed is that receivables in pharma usually don’t end up being bad debts and write offs because relationships between pharma cos and their clients are multi year and there is a lot of inter dependence. If one of Laurus’ large clients defaulted or delayed payments, Laurus could simply cut-off future supplies to that party and start recovery.
Besides who were these clients that owed money to Laurus? Were they some fly by night operators that would vanish into thin air some day? Or were these clients big MNCs that could potentially delay but not deny payments to Laurus? In my view, the answer was the latter and hence I took a big position despite their receivables being high, at 102 days at the time.
To conclude, like any other metric, a low CFO vs PAT can tell you there could be something getting cooked in the books. Yet, as the case of Sun Pharma shows, if the jockey is good, he can turn things around and a low CFO doesn’t become a problem then.
Too many times, we get stuck up on a single metric, and let go of some great opportunities, without looking at the grand scheme of things instead. If this isn’t analysis paralysis, what is?
Addendum – Case 5 – Zee TV during the TMT / Dotcom bubble phase
I was reading India’s Money Monarchs and this response by Mr. Samir Arora caught my attention, this morning (23rd Jan 2021).

“If you look at our history, both the reason for success and the reason for criticism are the same, “You hold your stocks too long.” Zee, multiplied 160 times since we bought it. Every Rs 10 invested in the company had multiplied to Rs 1600. But we did not multiply our investment to that extent because by the time we sold, it had already fallen to Rs 700. So, we basically ended up multiplying our investment 70 times. I remember having said in an interview with one of the business magazines that our year-end target for Zee was Rs 250 when the price was around Rs 100. However, the stock had multiplied 10 times by the time the year had ended and we did not sell during the year. Even if I had sold at Rs 300, I would have tripled my money in a year and that would have been considered as a great job. While some might say that not selling at Rs 300 was a good decision, others might criticize me for not selling at Rs 1600.”
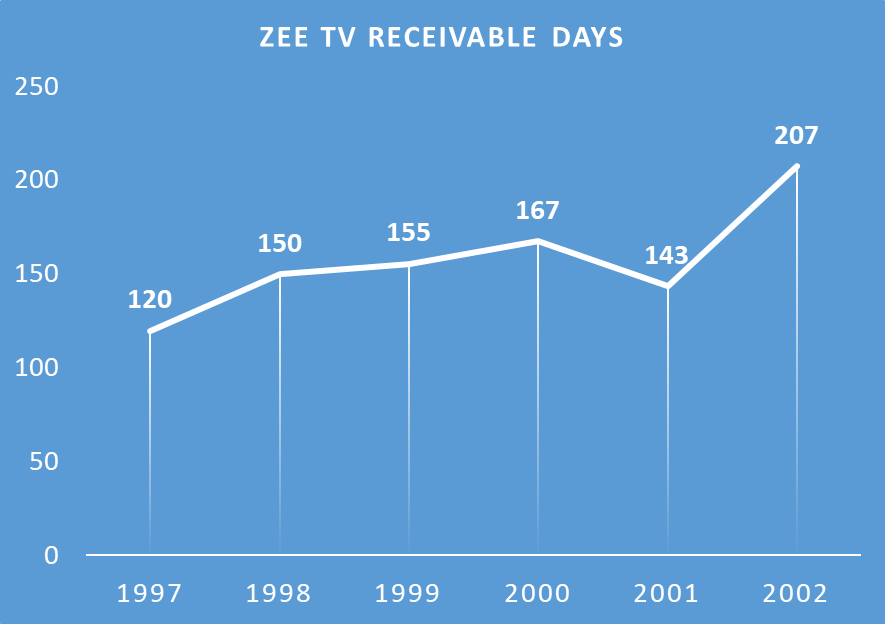
And then I looked at the numbers for Zee TV during those years and what I saw blew my mind.

Zee had a net cash flow of below zero while the TMT bull run was in progress. And the reason it’s insanely high receivable days. Zee was taking an average of 6 months to recover due owed to it by its customers.
Yet the market wasn’t worried because Zee went on to become a 100 bagger. Now I doubt how many people would have actually made 100x their money but we can at least get a rough idea of how things went.

Maybe the market was inefficient, back then. Or perhaps, it had a good enough reason because Zee’s profits had been growing at a very fast clip.

So yet again, we have a case where the market prioritized growth over balance sheet quality and cash flows and hence it makes sense to keep an open mind about all these metrics.
Disclaimer – Not SEBI registered. Not a recommendation to buy/sell any of the above mentioned stocks. Don’t hold any of the above either.
Barath Mukhi
7-Jan-2022